
Fig. 2.
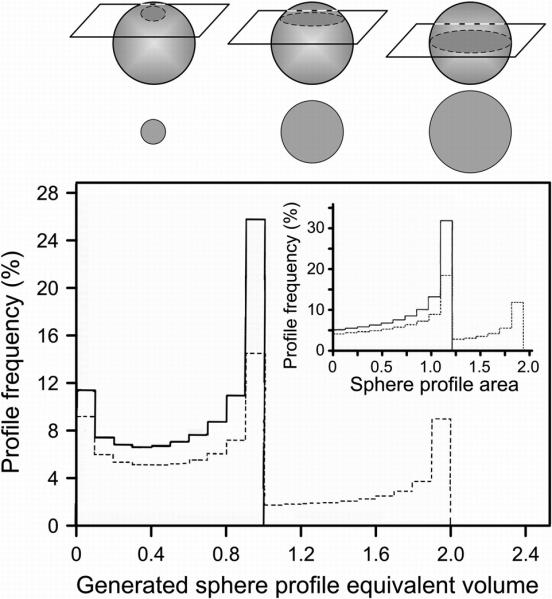
Model histograms of equivalent volumes calculated from (as shown in inset) cross section areas obtained by random sectioning of two populations of computer-generated spheres: a uniform population of spheres of 1-unit volume (solid lines) and a 1: 1 mixture of spheres of 1- and 2-unit volumes (dashed lines). The drawing above the histograms shows how the sectioning of spheres of identical volume will produce (left to right) small, intermediate or equatorial cross section areas, depending on the location of the section plan relative to the equator of the sphere. (Modified from I. Hammel, D. Lagunoff, M. Bauza, and E. Chi. Cell Tissue Res. 228: 51-59, 1983, with the permission of the publisher.)