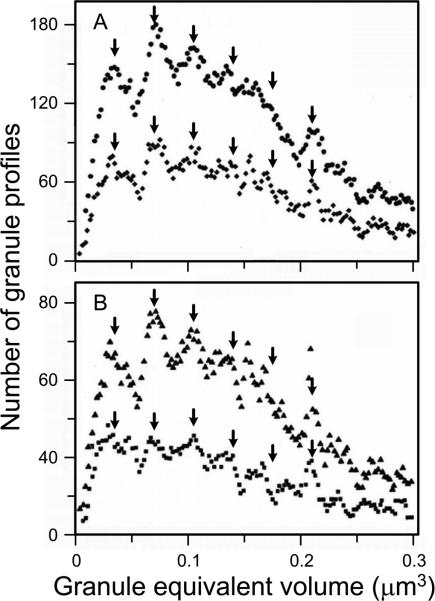
Fig. 3.
Moving-bin histogram of granule equivalent volumes calculated by using transmission electron micrographs to measure cross section areas of cytoplasmic granules in rat peritoneal mast cells. In (A), data for 2327 granules are presented using bin sizes of 0.0036 μm3 (μ3) (upper curve) and 0.0072 μ3 (lower curve). In (B), a bin size of 0.0045 μ3 is used to compare data obtained from 2327 granules (upper curve) vs. the first 1050 granules measured (lower curve). The arrows (V1, V2, V3, etc.) are placed at integral multiples of the mean intermodal distance calculated for each curve, a value that defines the magnitude of the “unit volume”. (Modified from I. Hammel, D. Lagunoff, M. Bauza, and E. Chi. Cell Tissue Res. 228: 51-59, 1983, with the permission of the publisher.)

