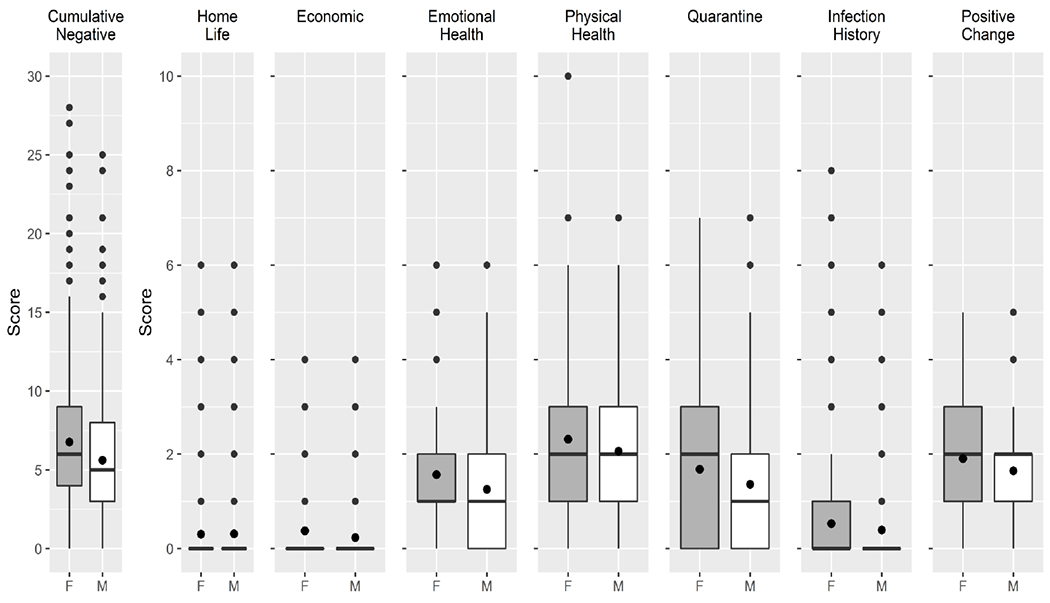
Figure 1: Cumulative Negative Risk Index and Domain-Specific Risk Indices, by Gender.

The box represents the interquartile range (IQR), split with a line to represent the median and a diamond to represent the mean. The whiskers extend to 1.5 times the IQR, with outliers represented by circles
