
Figure 1.
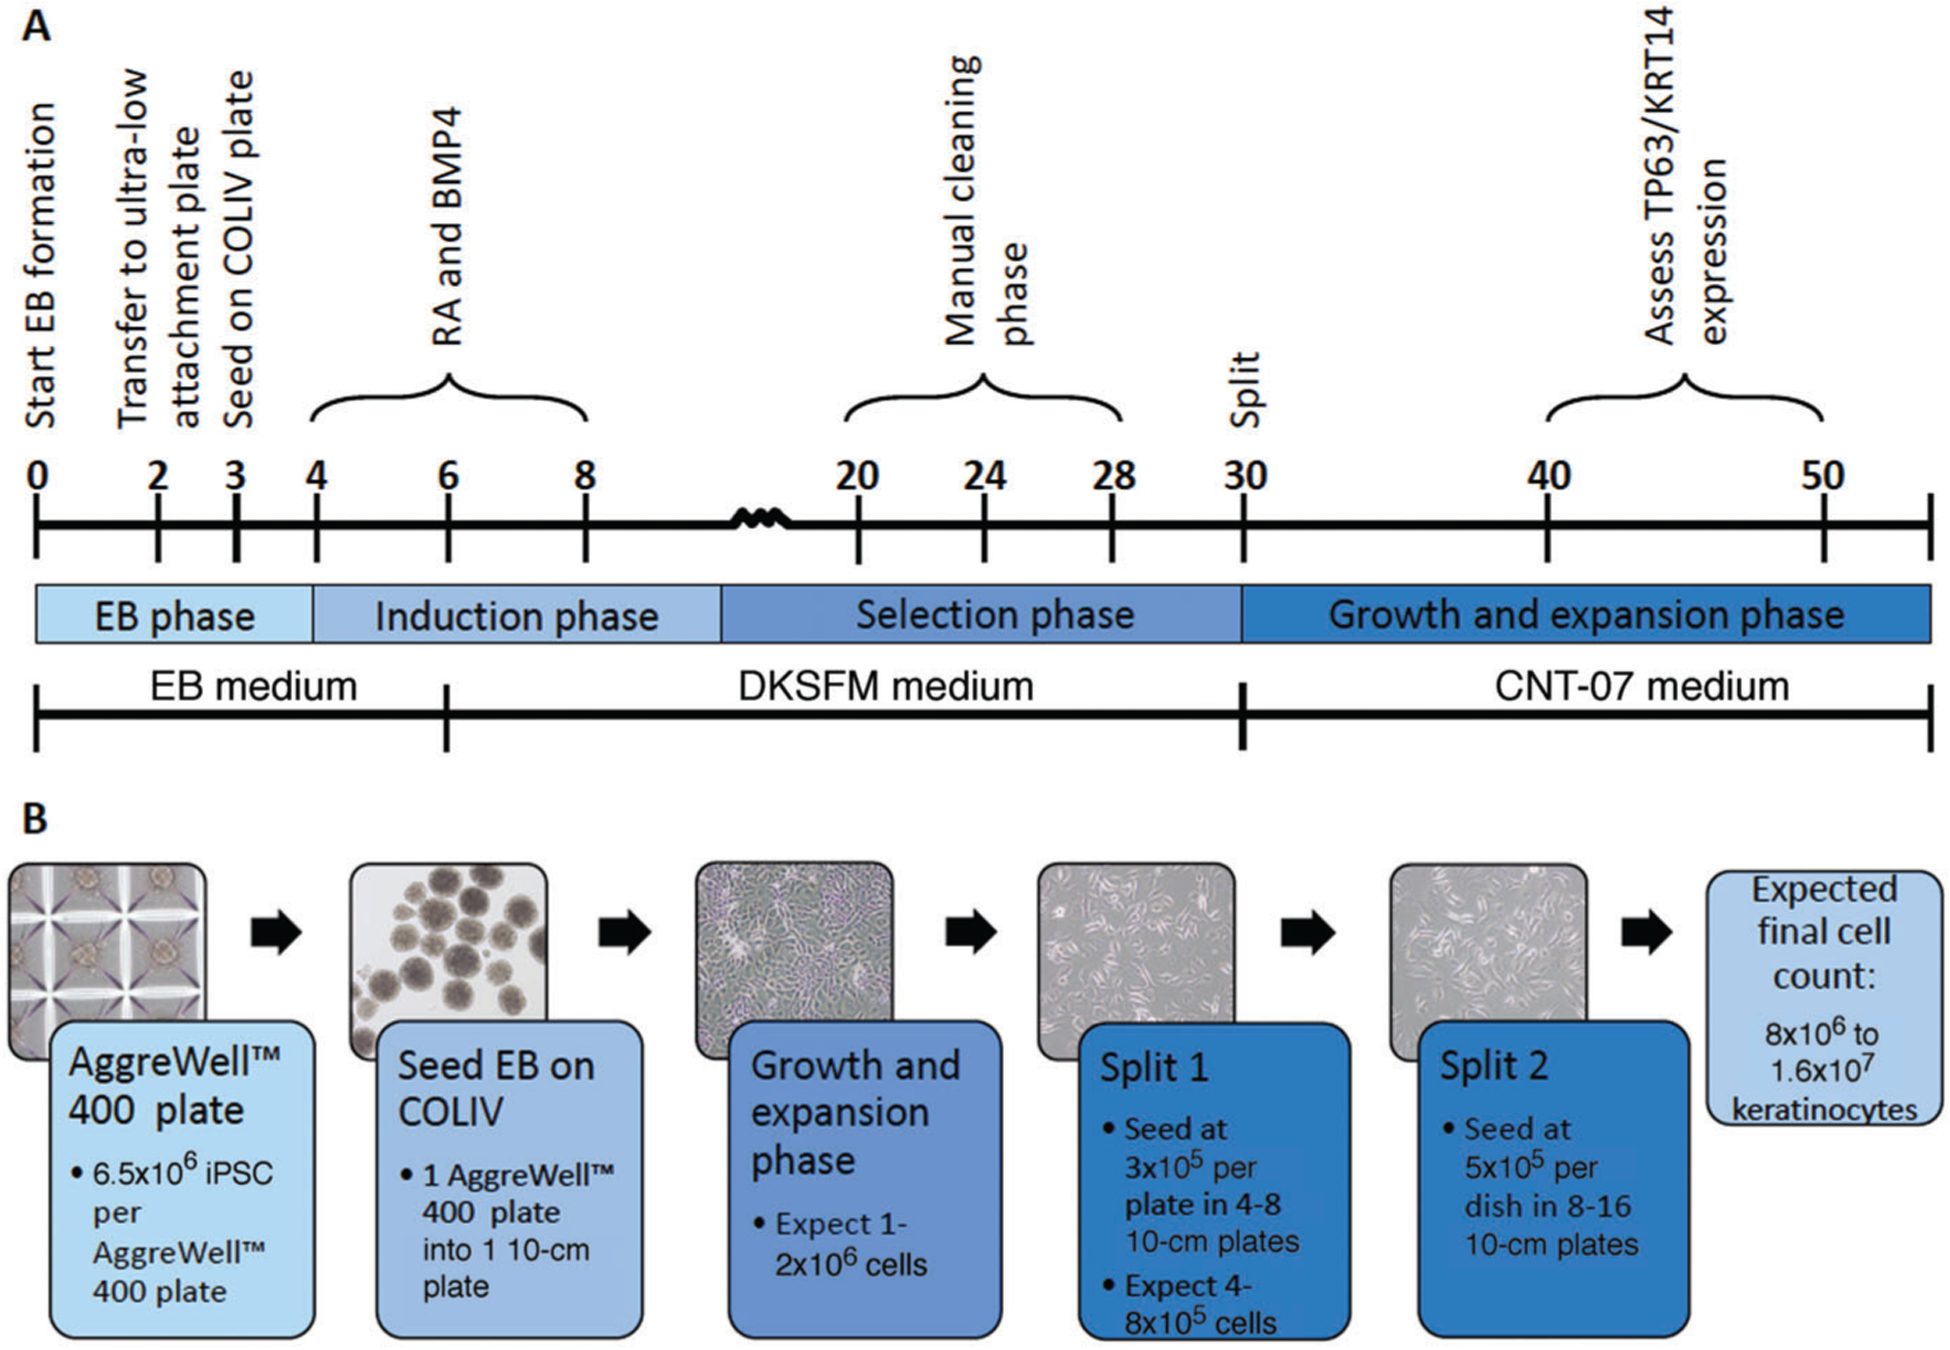
Timeline for iPSC-K generation. (A) Annotated timeline for the generation of iPSC-K. Numbers on the timeline reflect days. (B) Morphology as well as numbers of cells and plates generated using this protocol.
Official websites use .gov
A
.gov website belongs to an official
government organization in the United States.
Secure .gov websites use HTTPS
A lock (
) or https:// means you've safely
connected to the .gov website. Share sensitive
information only on official, secure websites.
Timeline for iPSC-K generation. (A) Annotated timeline for the generation of iPSC-K. Numbers on the timeline reflect days. (B) Morphology as well as numbers of cells and plates generated using this protocol.