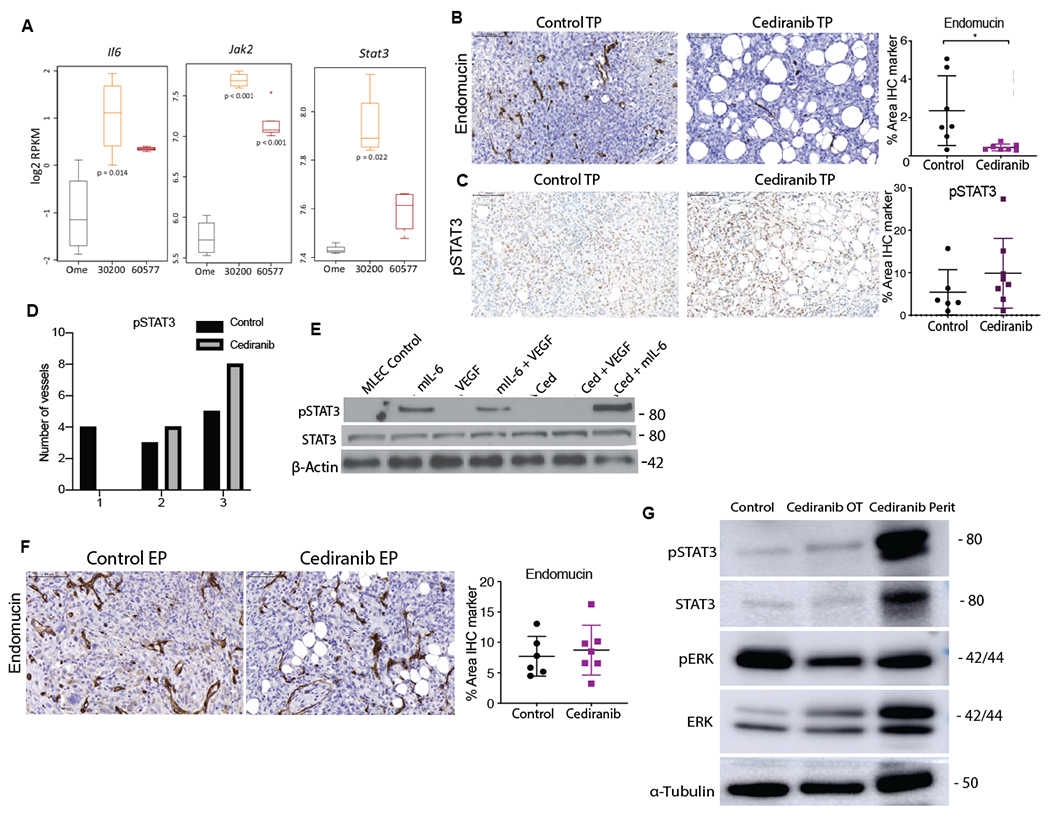
Figure 2: The IL-6 pathway is involved in development of resistance to cediranib in 30200 model.

A. Boxplots of log2RPKM gene expression of indicated genes in omentum, 30200 and 60577 tumors (n=4, 4,5 respectively). B. IHC for endomucin and pSTAT3 in control and cediranib short-term treated 30200 tumors. C. IHC for pSTAT3 in control and cediranib short-term treated 30200 tumors D. Intensity of pSTAT3 staining in control and cediranib short-term treated luminated vessels. E. Western blot analysis of pSTAT3, STAT3 and β-actin in MLEC treated with recombinant mIL-6, VEGF and cediranib F. IHC for endomucin in control and cediranib-treated 30200 tumors at survival end point. G. Western blot analysis of pSTAT3, STAT3, pERK, ERK and α-Tubulin in 30200 control treated omental tumors, cediranib-treated omental and peritoneal tumors collected at end point.
