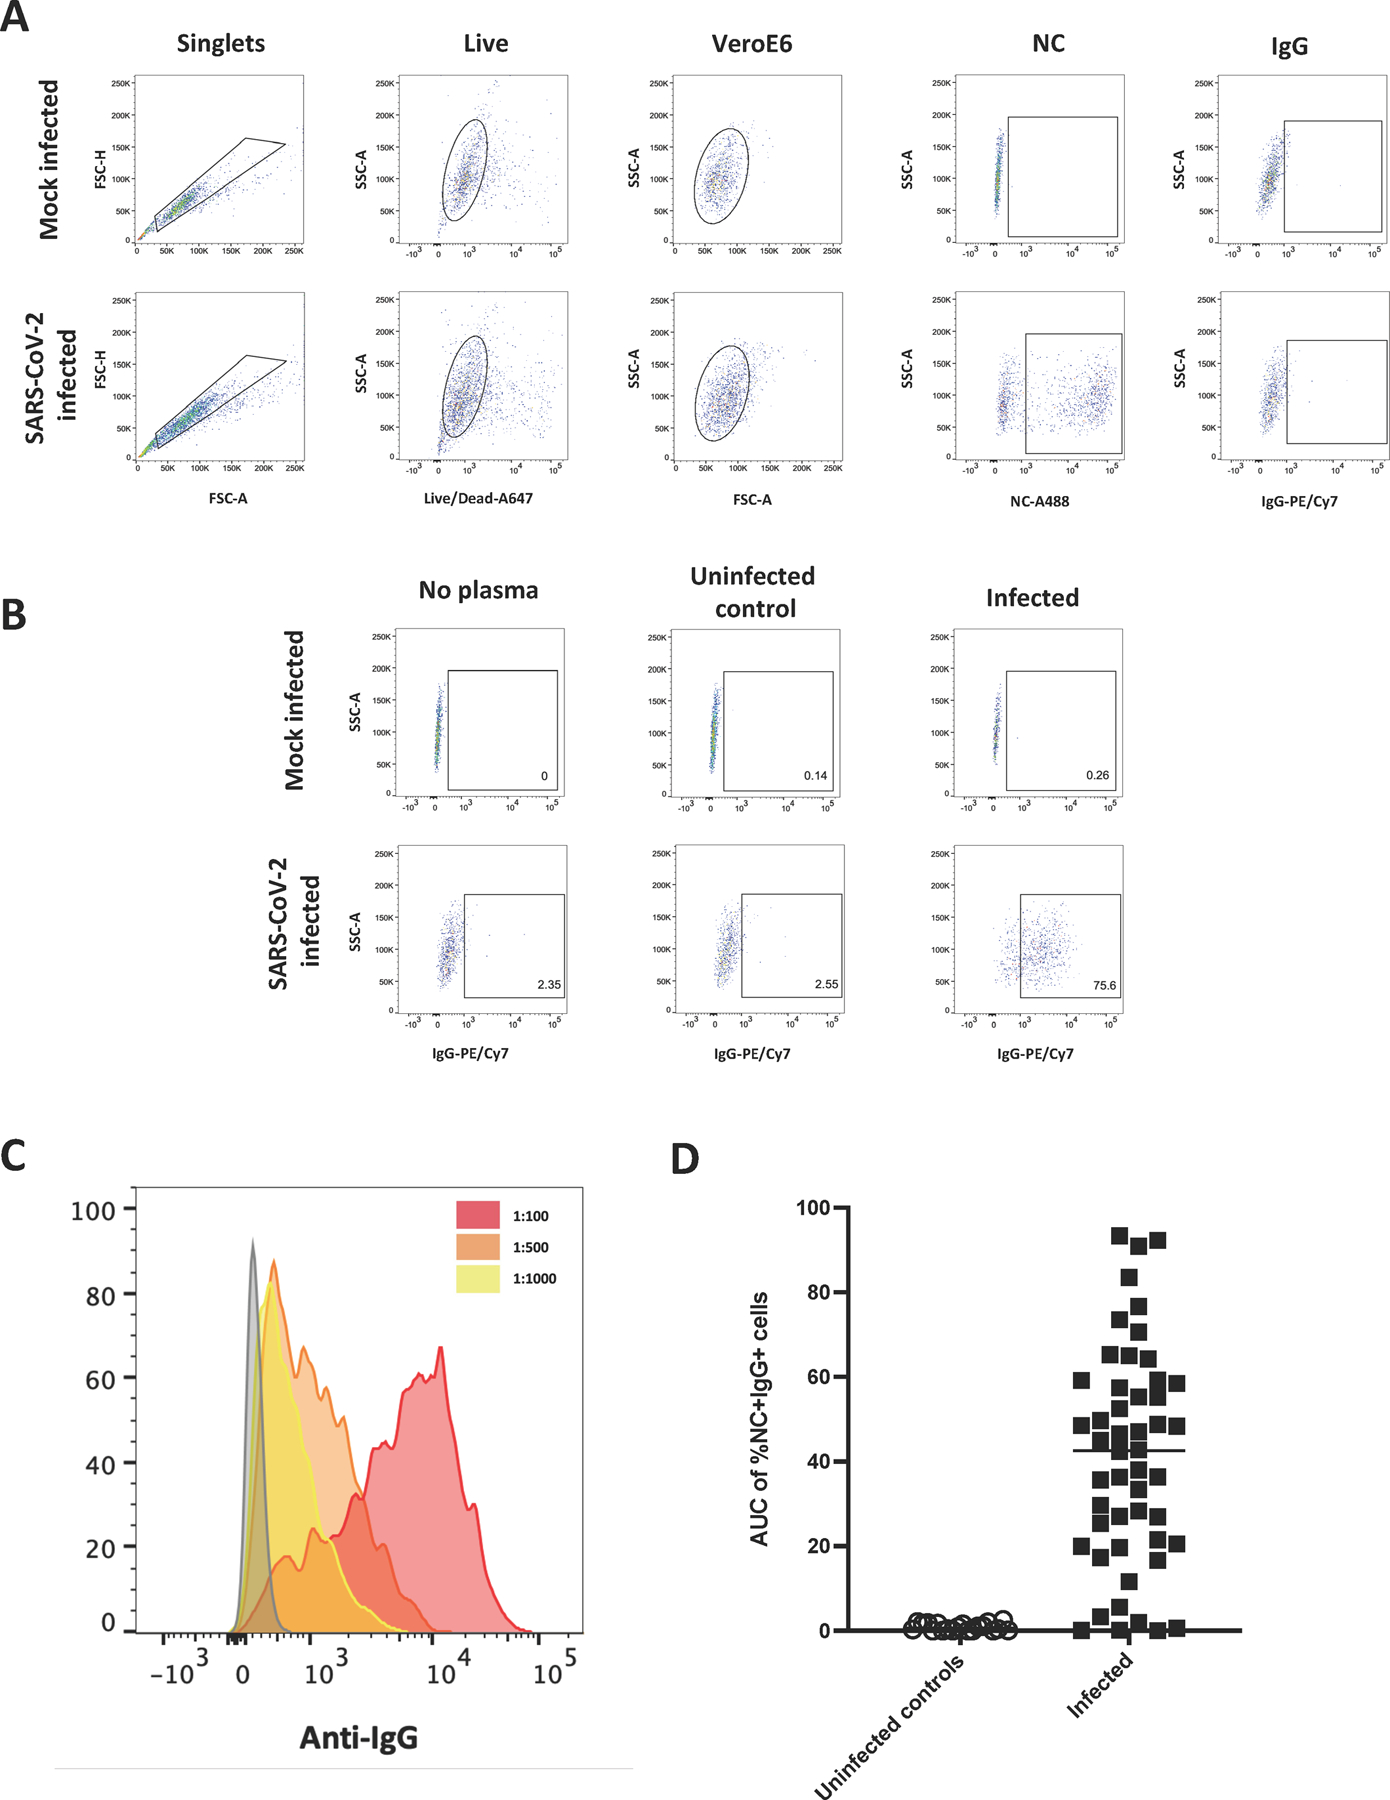
Figure 3. Quantitating binding of antibodies to SARS-CoV-2-infected cells using flow cytometry.

A gating strategy identifying singlets, live cells and Vero E6 cells was used to detect cells followed by gating for the presence of Nucleocapsid and IgG on mock infected and SARS-CoV-2-infected cells (A). No plasma, plasma from an uninfected individual and plasma from an infected individual were used to assess specificity of antibody binding to mock infected and SARS-CoV-2-infected cells (B). A histogram of events acquired using plasma from an infected individual which was diluted to three different dilutions (1:100, red; 1:500, orange and 1:1000, yellow) (C). The AUC of %NC+IgG+ cells at three dilutions (1:100, 1:500 and 1:1000) was calculated for uninfected controls (n=20) and SARS-CoV-2-infected individuals (n=50) (D).
