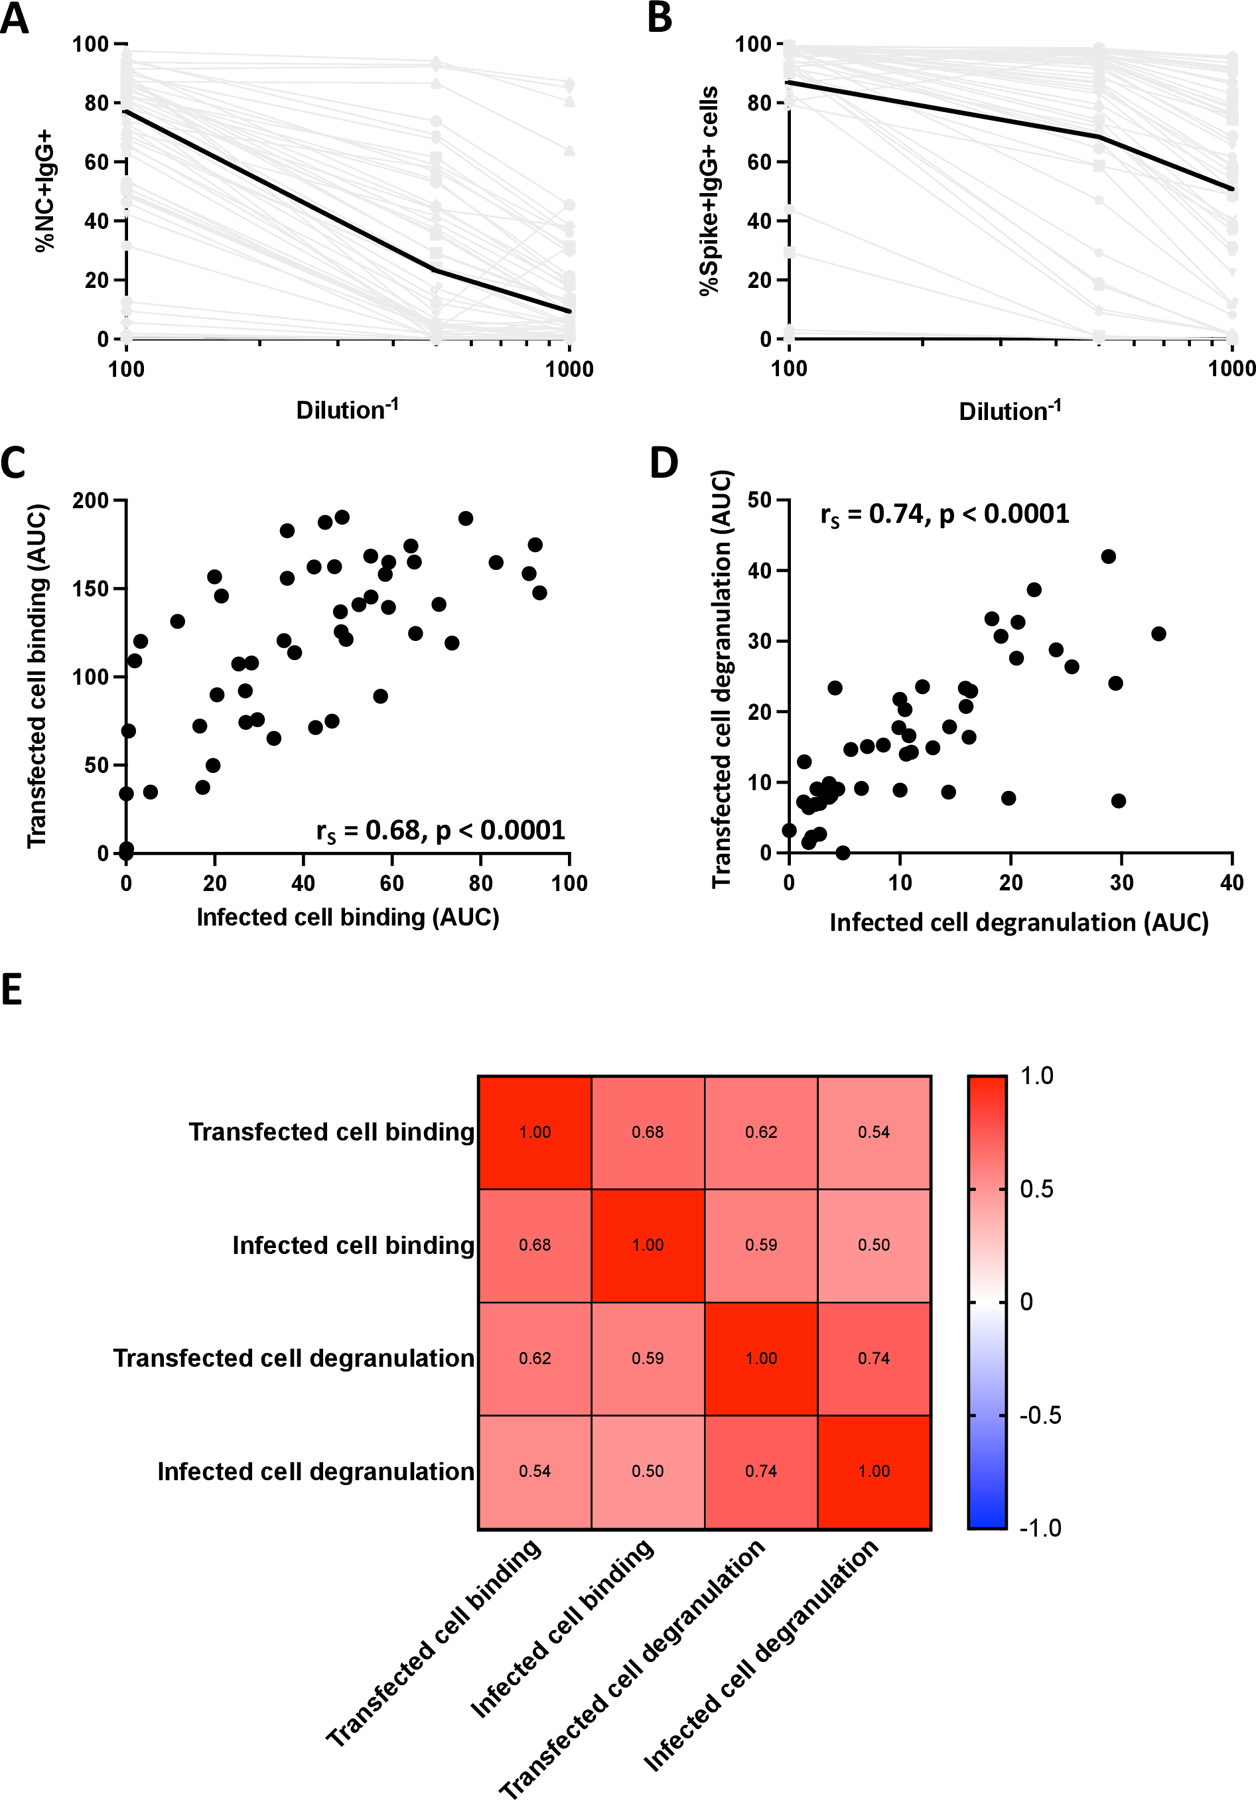
Figure 6. Relationship between transfected cell and infected cell assays.

Binding curves for plasma of the 50 SARS-CoV-2-infected individuals against infected (A) and transfected (B) cells were generated. Infected cell binding was measured by %NC+IgG+ cells and transfected cell binding was measured by %Spike+IgG+ cells. Spike+ cells were identified using an anti-flag antibody which bound to a flag tag fused to the c-terminus of the Spike protein. Median binding levels are shown by the black lines and grey lines indicated binding responses for individual plasma samples. The relationship between AUCs measured by transfected cell binding and infected cell binding (C) and AUCs of NK cell degranulation in the presence of transfected and infected cells (D) were calculated using a Spearman test. The relationship between all four assays was then determined using a Spearman test (D).
