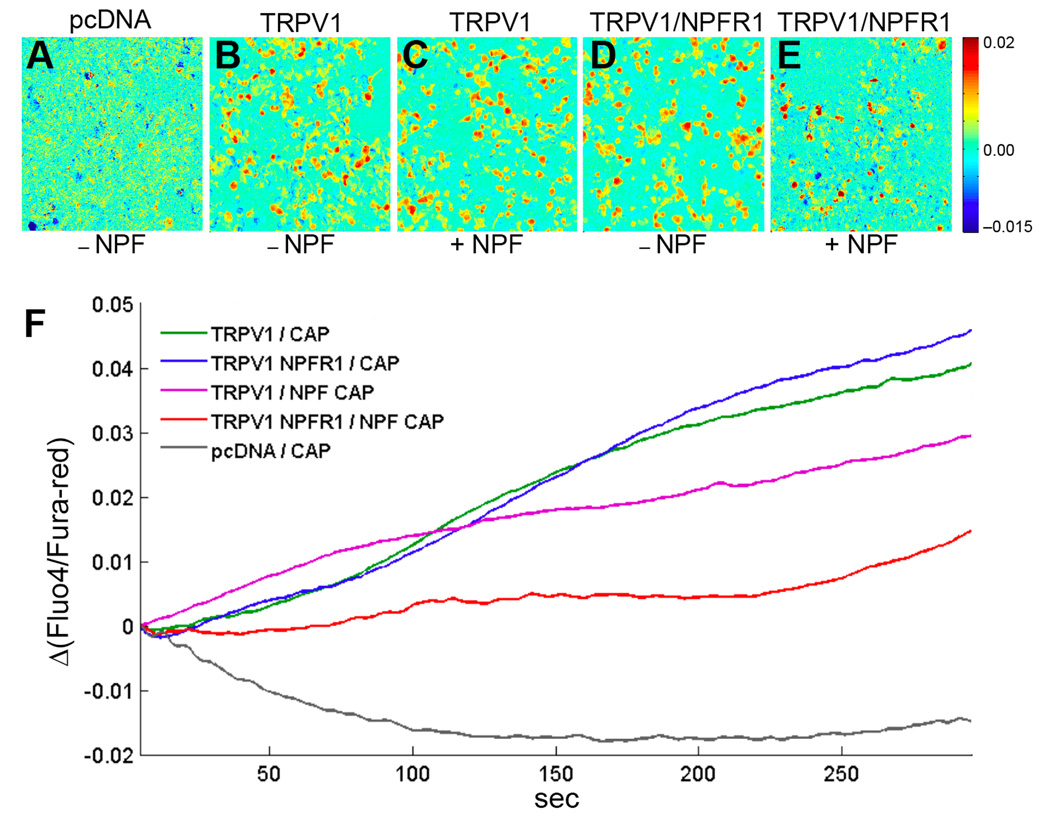
Figure 6.
NPFR1 suppresses Ca2+ influx mediated by rat TRPV1 in human cells. Ca2+ imaging and SOARS analysis of Human Embryonic Kidney (HEK) 293 cells expressing the TRPV1 channel. HEK 293 cells were loaded with the Fluo-4 and Fura-red fluorescent Ca2+ indicators, stimulated by 400 nM capsaicin (CAP) and imaged for 300s. Eigenimages highlight the clusters of pixels showing statistically significant anticorrelated changes in Fluo-4 and Fura-red fluorescence intensities. (A) An eigenimage of HEK cells transfected with empty pcDNA3.1 vectors. (B, C) Cells transfected with TRPV1 cDNA and stimulated by CAP in the absence or presence of 1 µM NPF. (D, E) Cells co-transfected with TRPV1 and NPFR1 cDNAs and stimulated by CAP in the absence or presence of NPF. (F) SOARS analysis of changes in the ratio between Fluo-4 to Fura-red fluorescence levels during the entire 300-sec recording period. Each trace is generated from at least 3 independent experiments. For example, during a 5-second interval starting at t=150 second, the p values are: P=1.3×10⁻¹² (TRPV1/NPFR1/NPF/CAP vs TRPV1/NPFR1/CAP); P=0.026 (TRPV1/NPFR1/NPF/CAP vs TRPV1/NPF/CAP; P=0.28 (TRPV1/NPFR1/CAP vs TRPV1 NPF/CAP).

