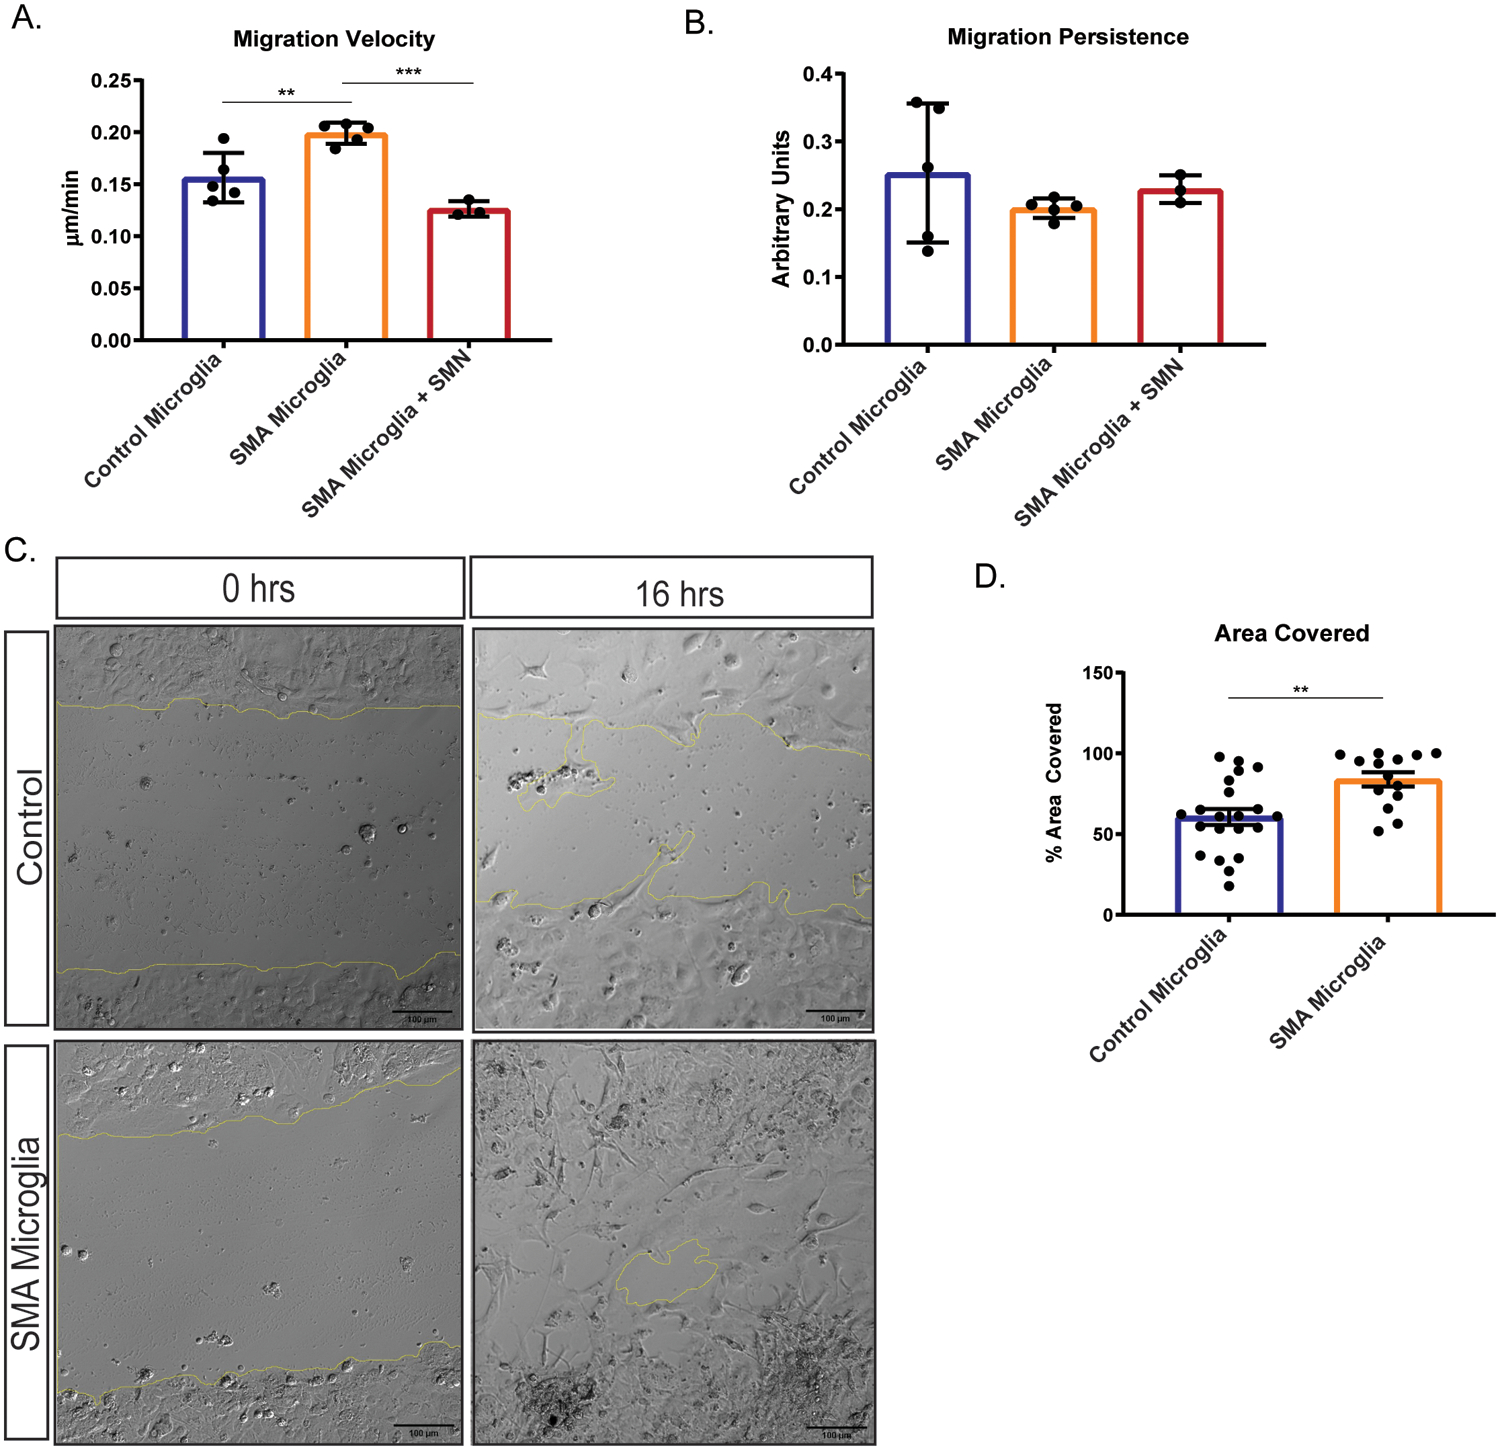
Figure 5. Cell velocity is increased in SMA patient iPSC derived microglia compared to control.

Velocity and persistence of control (n=5; minimum of 14 cells per group) and SMA patient iPSC derived microglia (n = 5; minimum of 14 cells per group) was performed using video analysis over 16 h, with images taken every 10 min. A. Velocity was significantly increased, **p=0.0061. SMN levels were restored in SMA microglia (n=3; minimum of 50 cells per group) and velocity and analyzed. Transiently expressing SMN restored the cell velocity of SMA microglia to control cell levels. ****p=<0.0001. B. No change in persistence was detected in SMA vs control microglia. Restoring SMN levels did not alter persistence. All groups were analyzed by unpaired t-test. Values represent mean ±SEM. C. Representative photomicrographs depicting unaffected and SMA iPSC-derived microglia plated in a monolayer following a scratch wound. A single wound was administered, and cell chamber was imaged every 10 min for 16 h and D. total area occupied by migrating cells and, E. total distance covered over time (rate) was quantified using ImageJ. (Area covered **p=0.0024; rate **p=0.0051). Significance was determined by one-way ANOVA followed by post hoc Tukey’s test for multiple comparisons. Values represent mean ±SEM.
