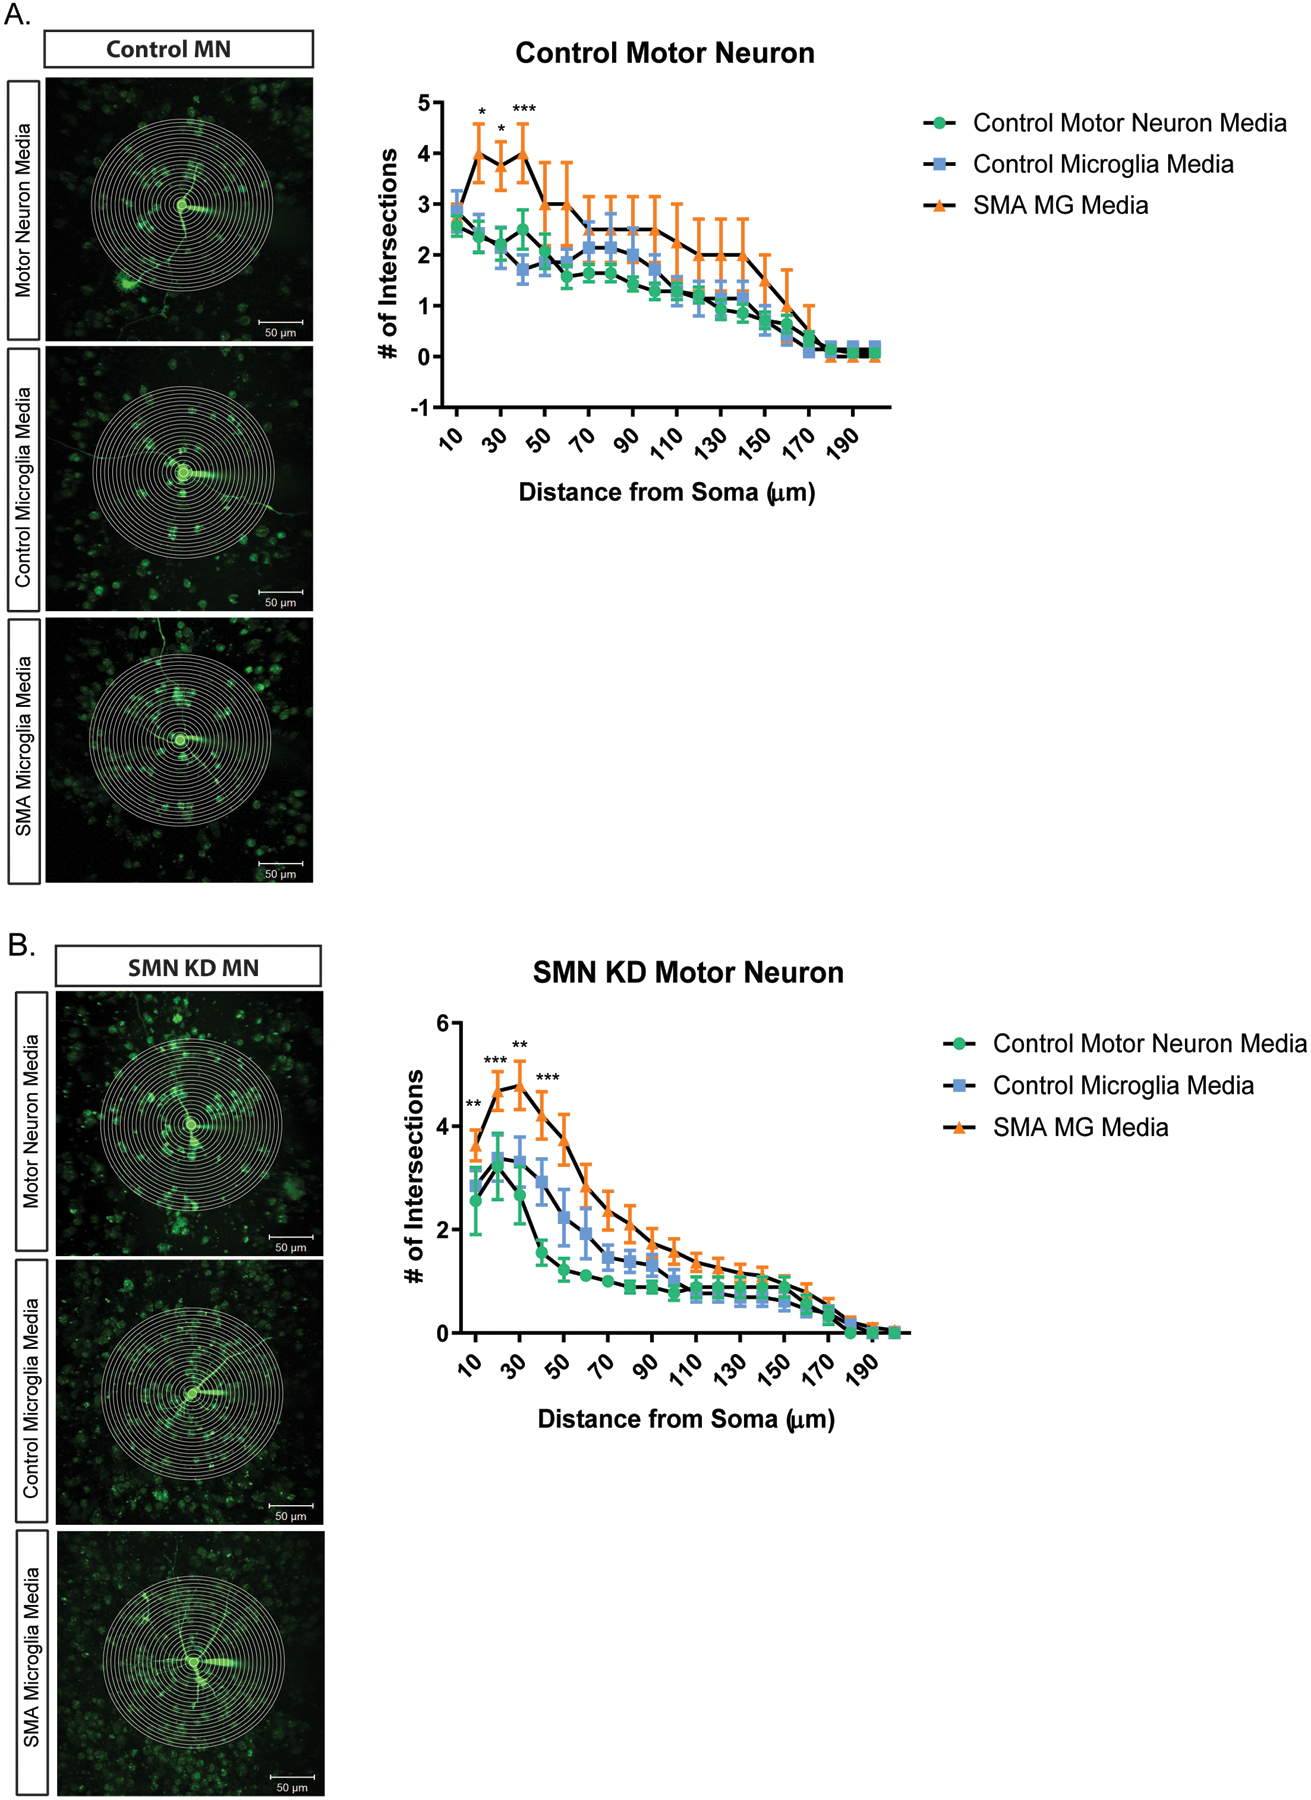
Figure 8. Motor neurons treated with SMA iPSC derived microglia conditioned media result in increased branching.

Representative images and plot of Sholl analysis of motor neurons treated with microglia conditioned media. Total number of crossings was counted at start radius of 10 μm, with a step radius 10 μm. Branching was recorded up to 200 μm for all groups. Control motor neurons (A.) and SMN deficient motor neurons (B.) were treated for 24 h in control motor neuron media (green), unaffected iPSC derived microglia media (blue), and SMA iPSC derived microglia media (orange). Two-way ANOVA was used followed by post hoc Bonferroni for Multiple Comparisons to analyze the Sholl plots between groups. Significance was determined when comparing unaffected iPSC derived microglia media to SMA iPSC derived microglia media. a. *p=0.0131, * p=0.0108, *** p=<0.001 (left to right). b. **p=0.0037, *** p=0.0007, ** p=0041, *** p=0.0006, left to right. Values represent mean ±SEM.
