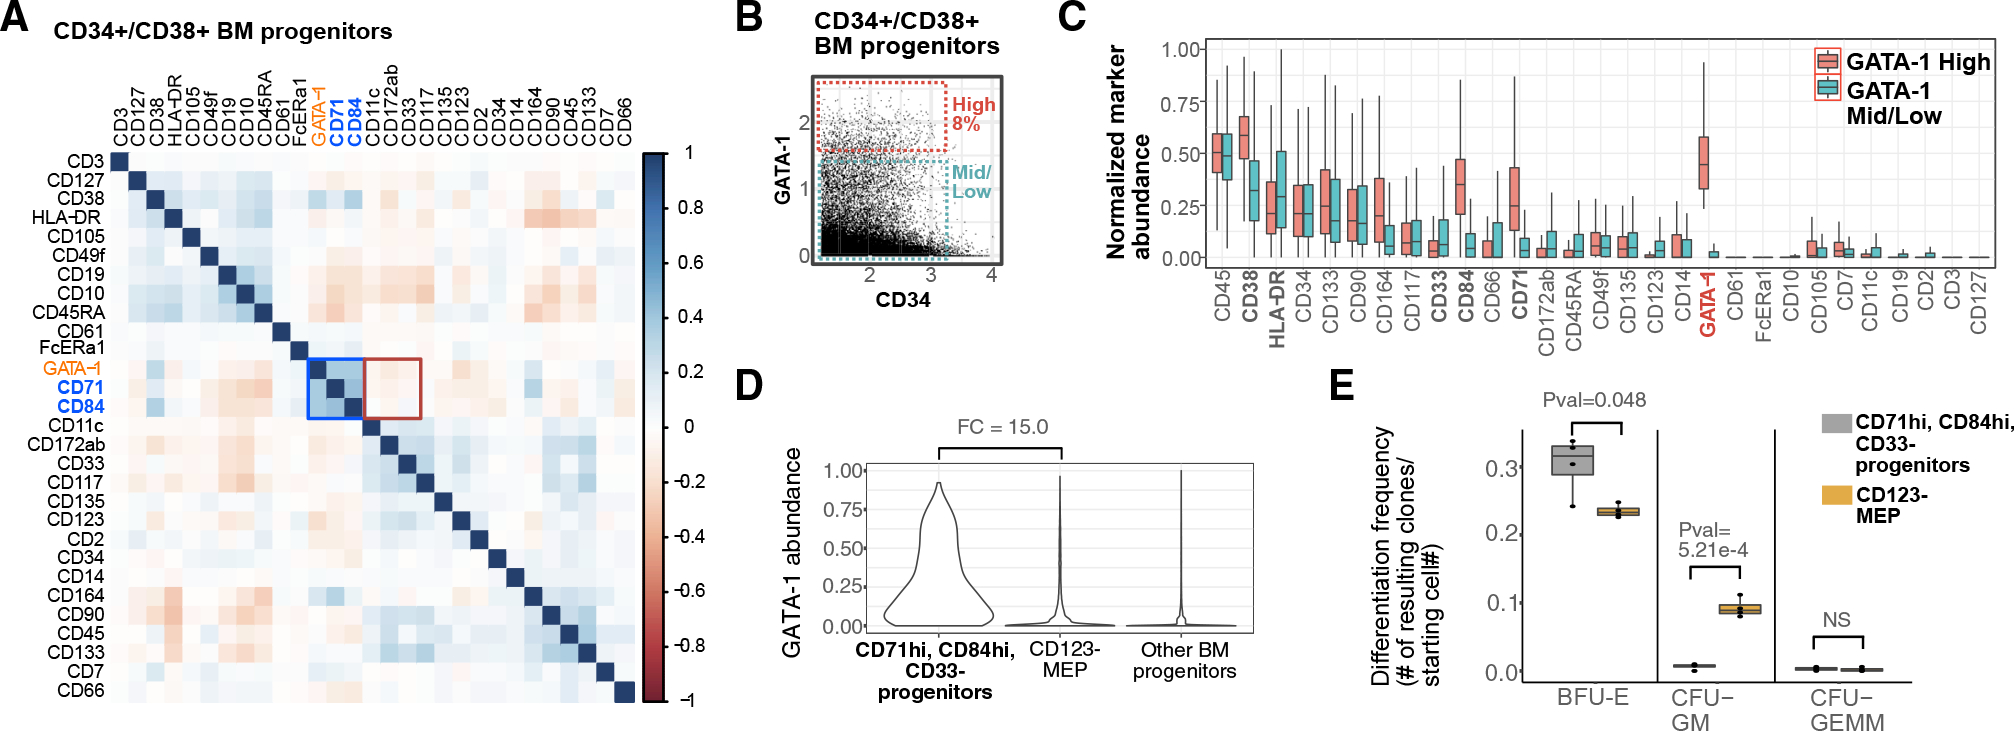
Figure 4. Surface-marker-defined BM population surrogate for high GATA-1 protein abundance clonally enriches for erythroid lineage.

(A) Spearman correlation plot of surface markers and GATA-1 abundance in BM progenitors as measured by mass cytometry.
(B) Top 8% of GATA-1-expressing cells in CD34+/CD38+ BM progenitors gated as GATA-1-high BM cells, and remaining GATA-1-mid/low cells used for subsequent analysis.
(C) Boxplots of normalized surface-marker abundance of GATA-1-high BM progenitors (top 8% of expression) and GATA-1-mid/low BM progenitors (bottom 87% of expression) from mass cytometry.
(D) Violin plots of GATA-1 protein abundance in manually gated target populations (as defined by CD71+, CD84+, CD33−), CD123− MEP populations, and in other BM progenitor populations.
(E) Boxplot of clonal differentiation frequency of target population and CD123− MEP population to different lineages/population types across 4 biological replicates. (p values calculated using Student’s t test)
