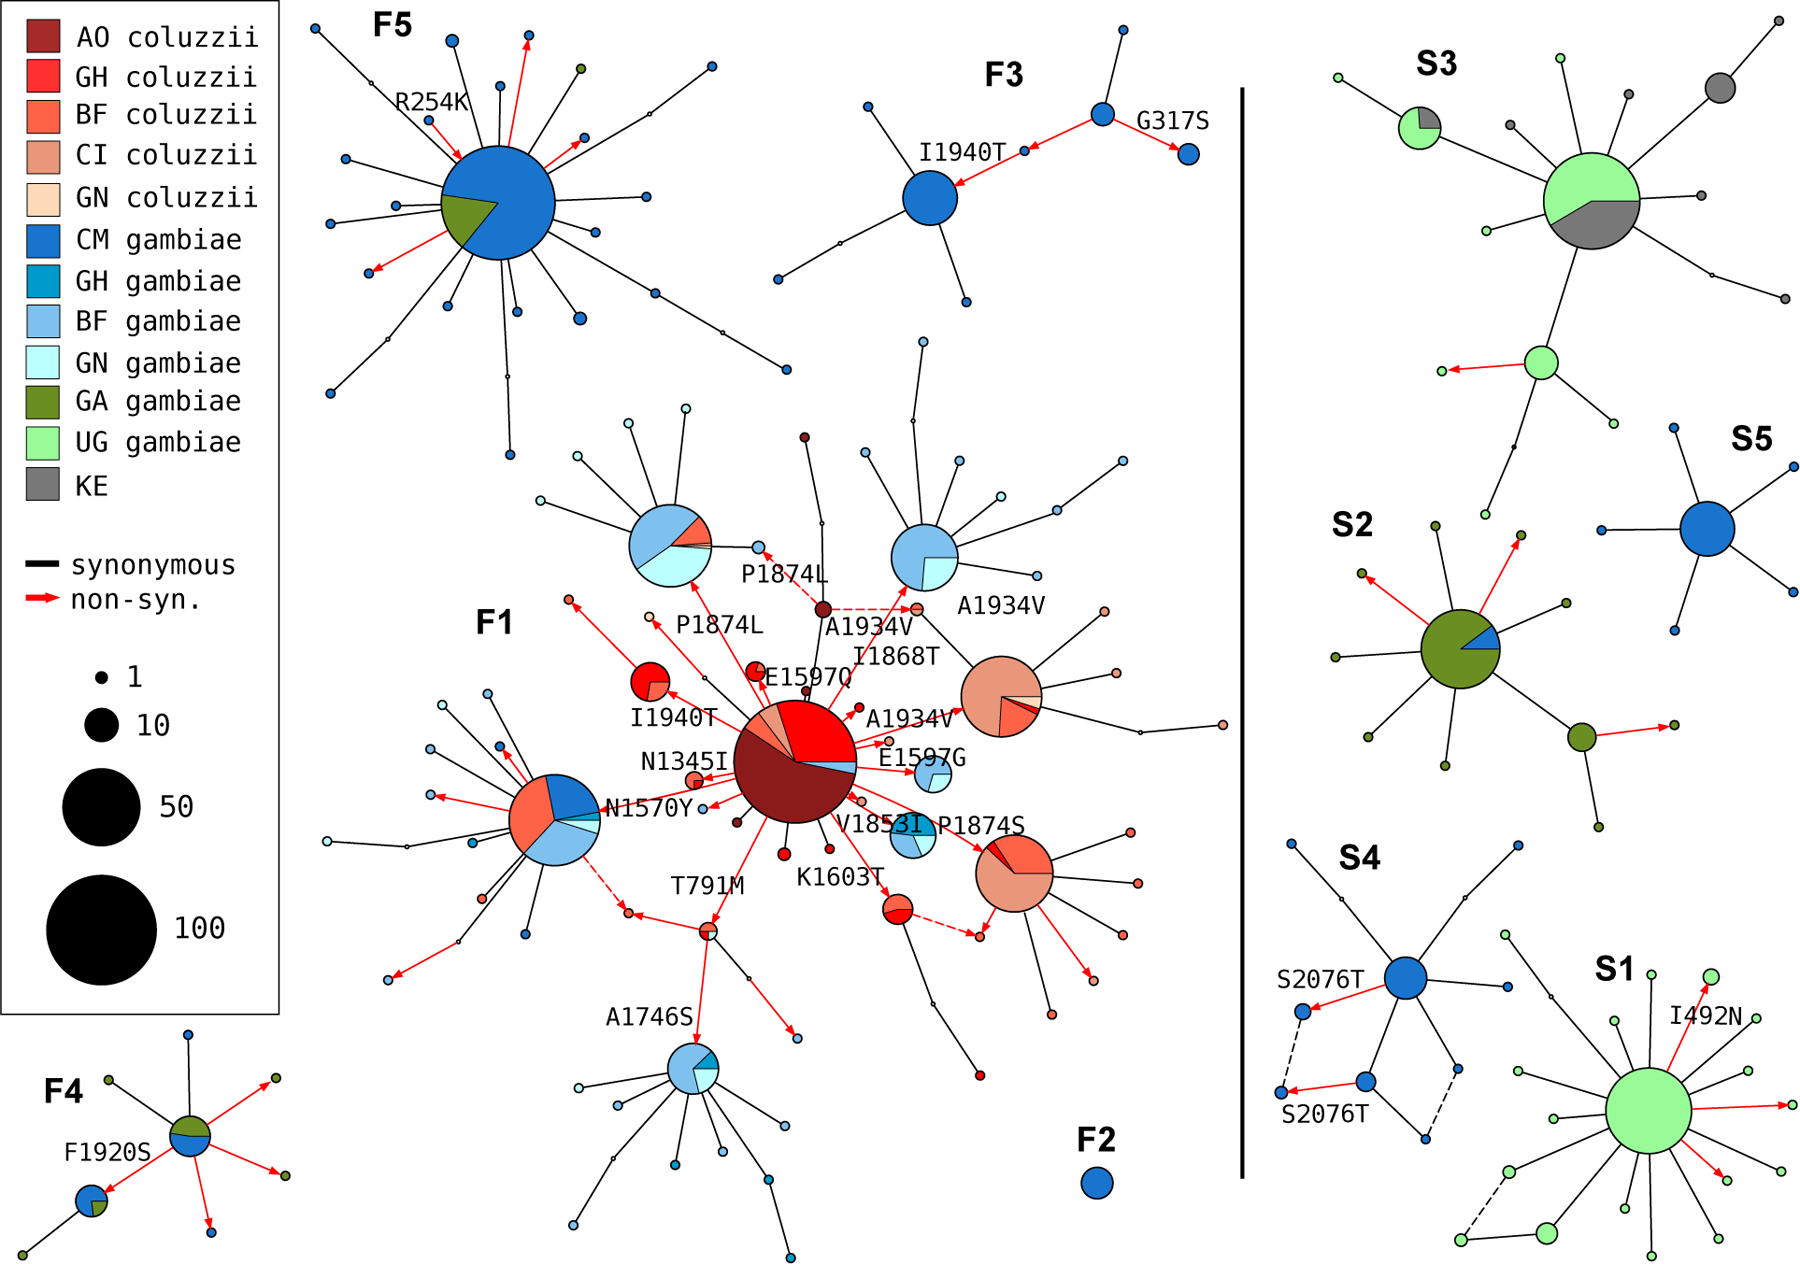
Figure 3. Haplotype networks.

Median joining network for haplotypes carrying L995F (labelled F1-F5) or L995S variants (S1-S5) with a maximum edge distance of two SNPs. Labelling of network components is via concordance with hierarchical clusters discovered in [23]. Node size is relative to the number of haplotypes contained and node colour represents the proportion of haplotypes from mosquito populations/species - AO=Angola; GH=Ghana, BF=Burkina Faso; CI=Côte d’Ivoire; GN=Guinea; CM=Cameroon; GA=Gabon; UG=Uganda; KE=Kenya. Non-synonymous edges are highlighted in red and those leading to non-singleton nodes are labelled with the codon change, arrow head indicates direction of change away from the reference allele. Network components with fewer than three haplotypes are not shown.
