
Figure 2. The reduction of CLN-evoked responses on iSPN was attributable to synaptic pruning.
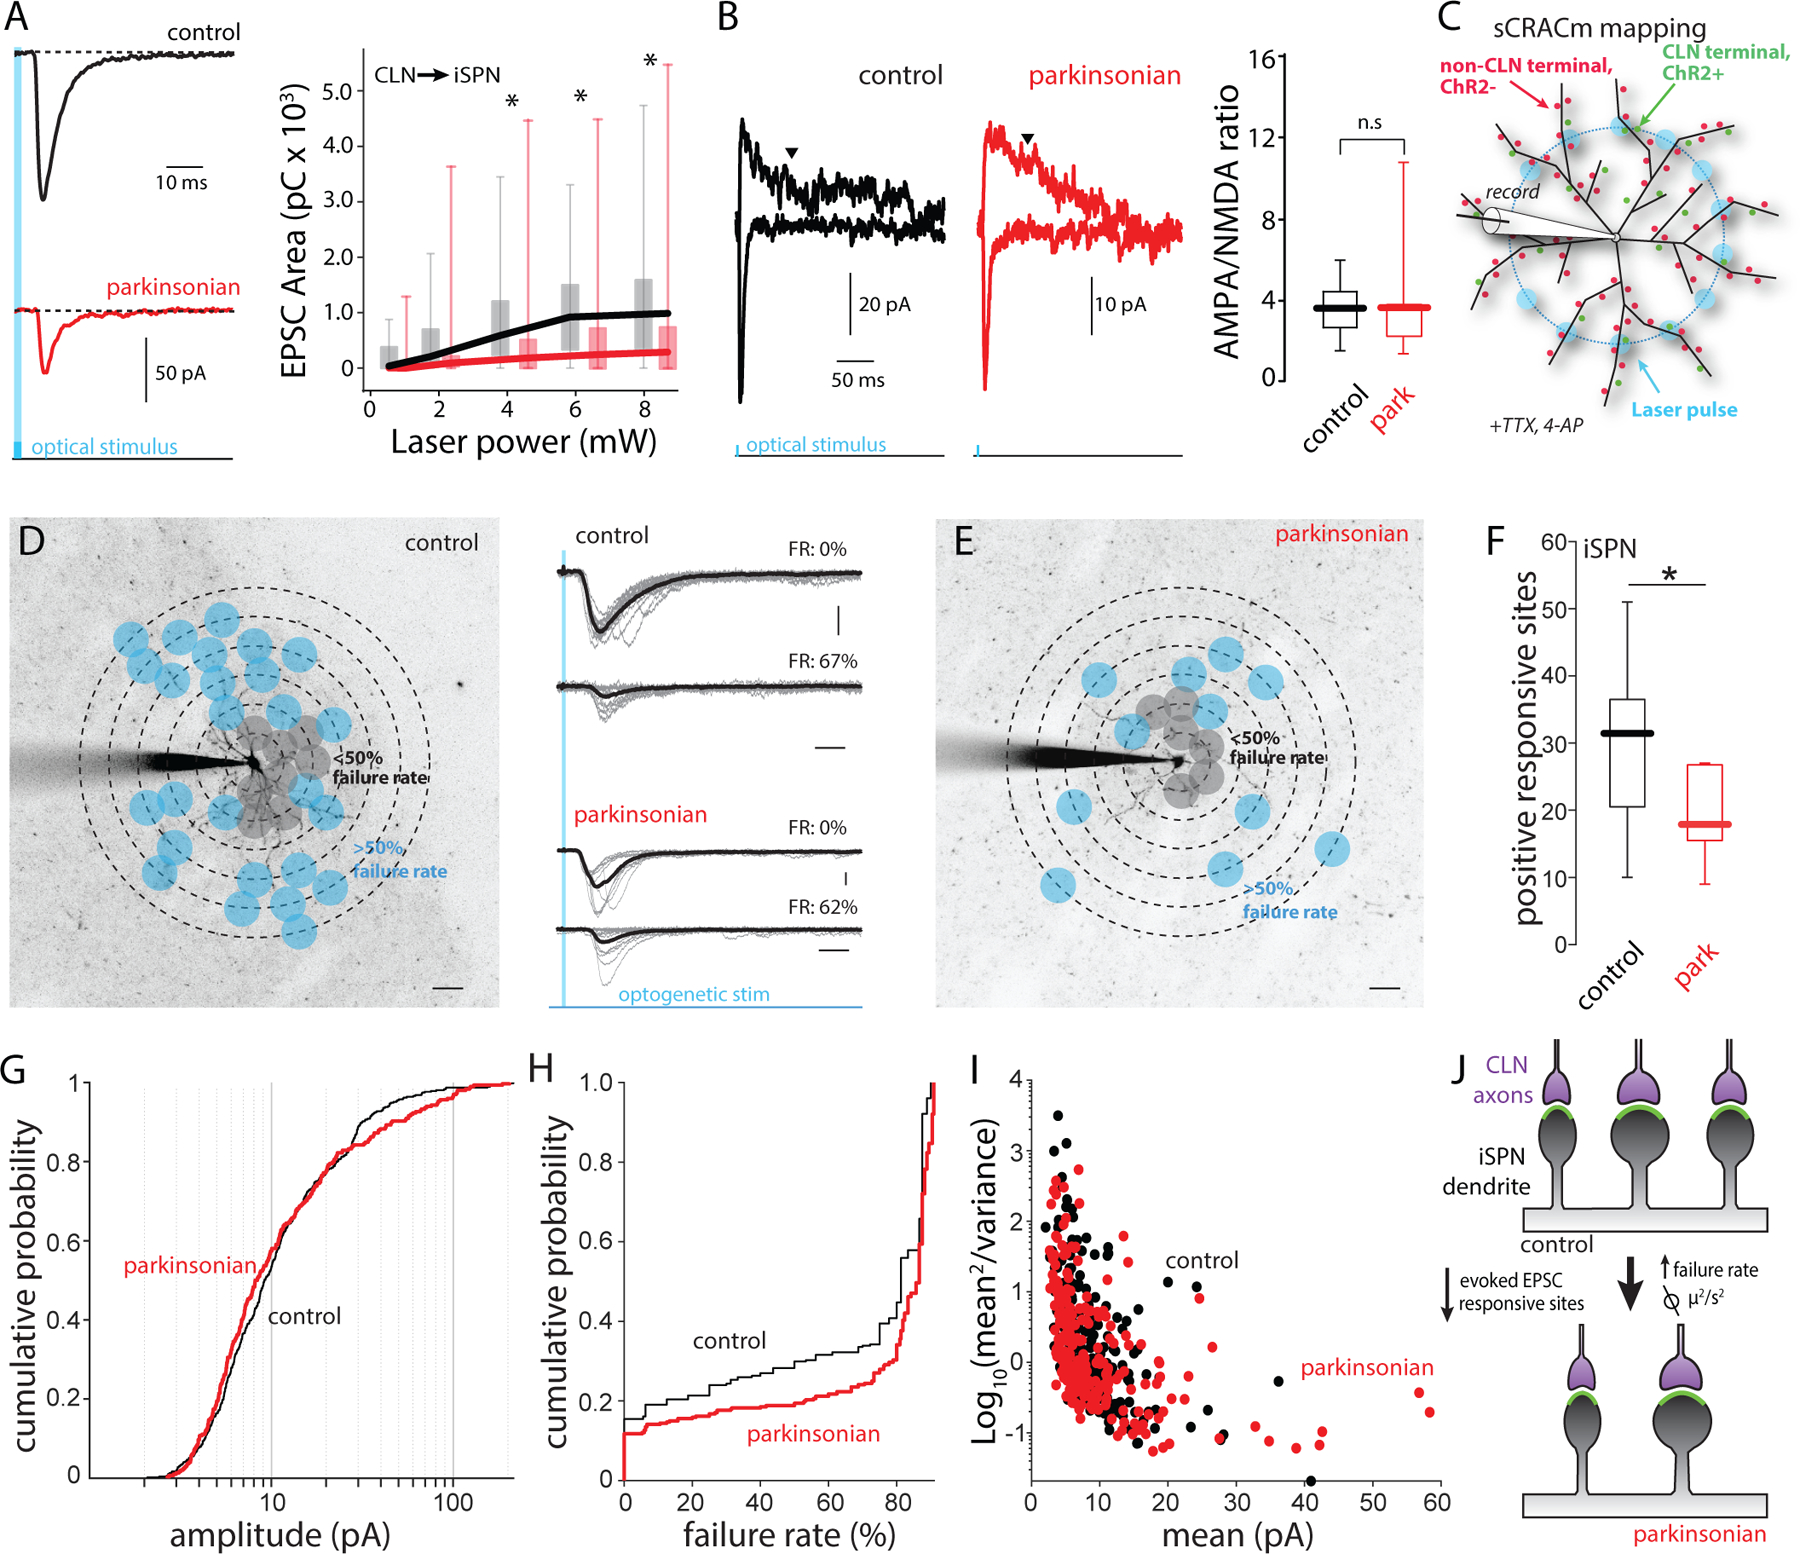
(A) Input-output curves of CLN-evoked EPSCs in iSPNs from control (black) and parkinsonian (red) mice. Left: Representative traces of CLN-evoked EPSCs. Right: CLN-EPSC areas (pC) are plotted against laser intensity. control vs parkinsonian (Laser power (mW)): P = 0.033 (8.35), P = 0.023 (6.25), P = 0.026 (4.41), P = 0.089 (2.04), P = 0.077 (0.98), rank- sum test. control: n = 20, N = 9. parkinsonian: n = 26, N = 10. (B) AMPA/NMDA ratios of CLN synapses on iSPNs from control and parkinsonian mice. Left: representative traces showing CLN-EPSCs evoked by large area stimulation. AMPA EPSCs were measured by peak amplitude at −70 mV. NMDA EPSCs were measured at + 40 mV. Downwards arrowheads indicate the time point (200 ms from stimulation) when NMDA EPSCs were measured. Right: Box plots of AMPA/NMDA ratios of CLN synapses on iSPN from control and parkinsonian mice. control vs parkinsonian; P = 0.6943, rank- sum test. control: n = 8, N = 4. Parkinsonian: n = 7, N = 4. (C) Schematic diagram of sCRACm CLN mapping. The diagram shows the example of blue laser stimulation on a middle concentric circle. (D and E) Example CLN input mappings from iSPNs of control (D) and parkinsonian (E). Projection image superimposed by mapping grid. Gray dots indicate responsive sites with less than 50% failure rates. Blue dots indicate responsive sites with 51 % < failure rate < 90%. Scale bar; 20 µm. Middle: Example traces with failure rate (FR). Gray thin lines are evoked responses at a typical stimulation spot. Thick black lines are averages of the individual traces. Scale bar: 20 pA and 20 ms. (F) Box plots of responsive sites in iSPN from control and parkinsonian mice. control median value; 31.5, parkinsonian median value; 19.5. control vs parkinsonian; P = 0.0258, rank-sum test. control: n = 14, N = 12, parkinsonian: n = 14, N = 8. (G) Cumulative probability of CLN-iSPN EPSC peak amplitudes obtained from input mapping experiments. Control vs parkinsonian; P = 0.2634, KS test. control: event number: n = 469, parkinsonian: event number: n = 298. (H) Cumulative probability of failure rates of CLN-iSPN EPSC. P < 0.001, KS test. control: event number: n = 913, parkinsonian: event number: n = 1162. (I) Variance plots of CLN-iSPN EPSC. The events with over 50% failure rates were analyzed. control: event number: n = 234, parkinsonian: event number: n = 232. (J) Summary diagram of the change of CLN synapses on iSPN.