
Figure 2: SARS-CoV-2 clearance in CD4+ and CD8+ T cell depleted WT and μΜΤ mice.
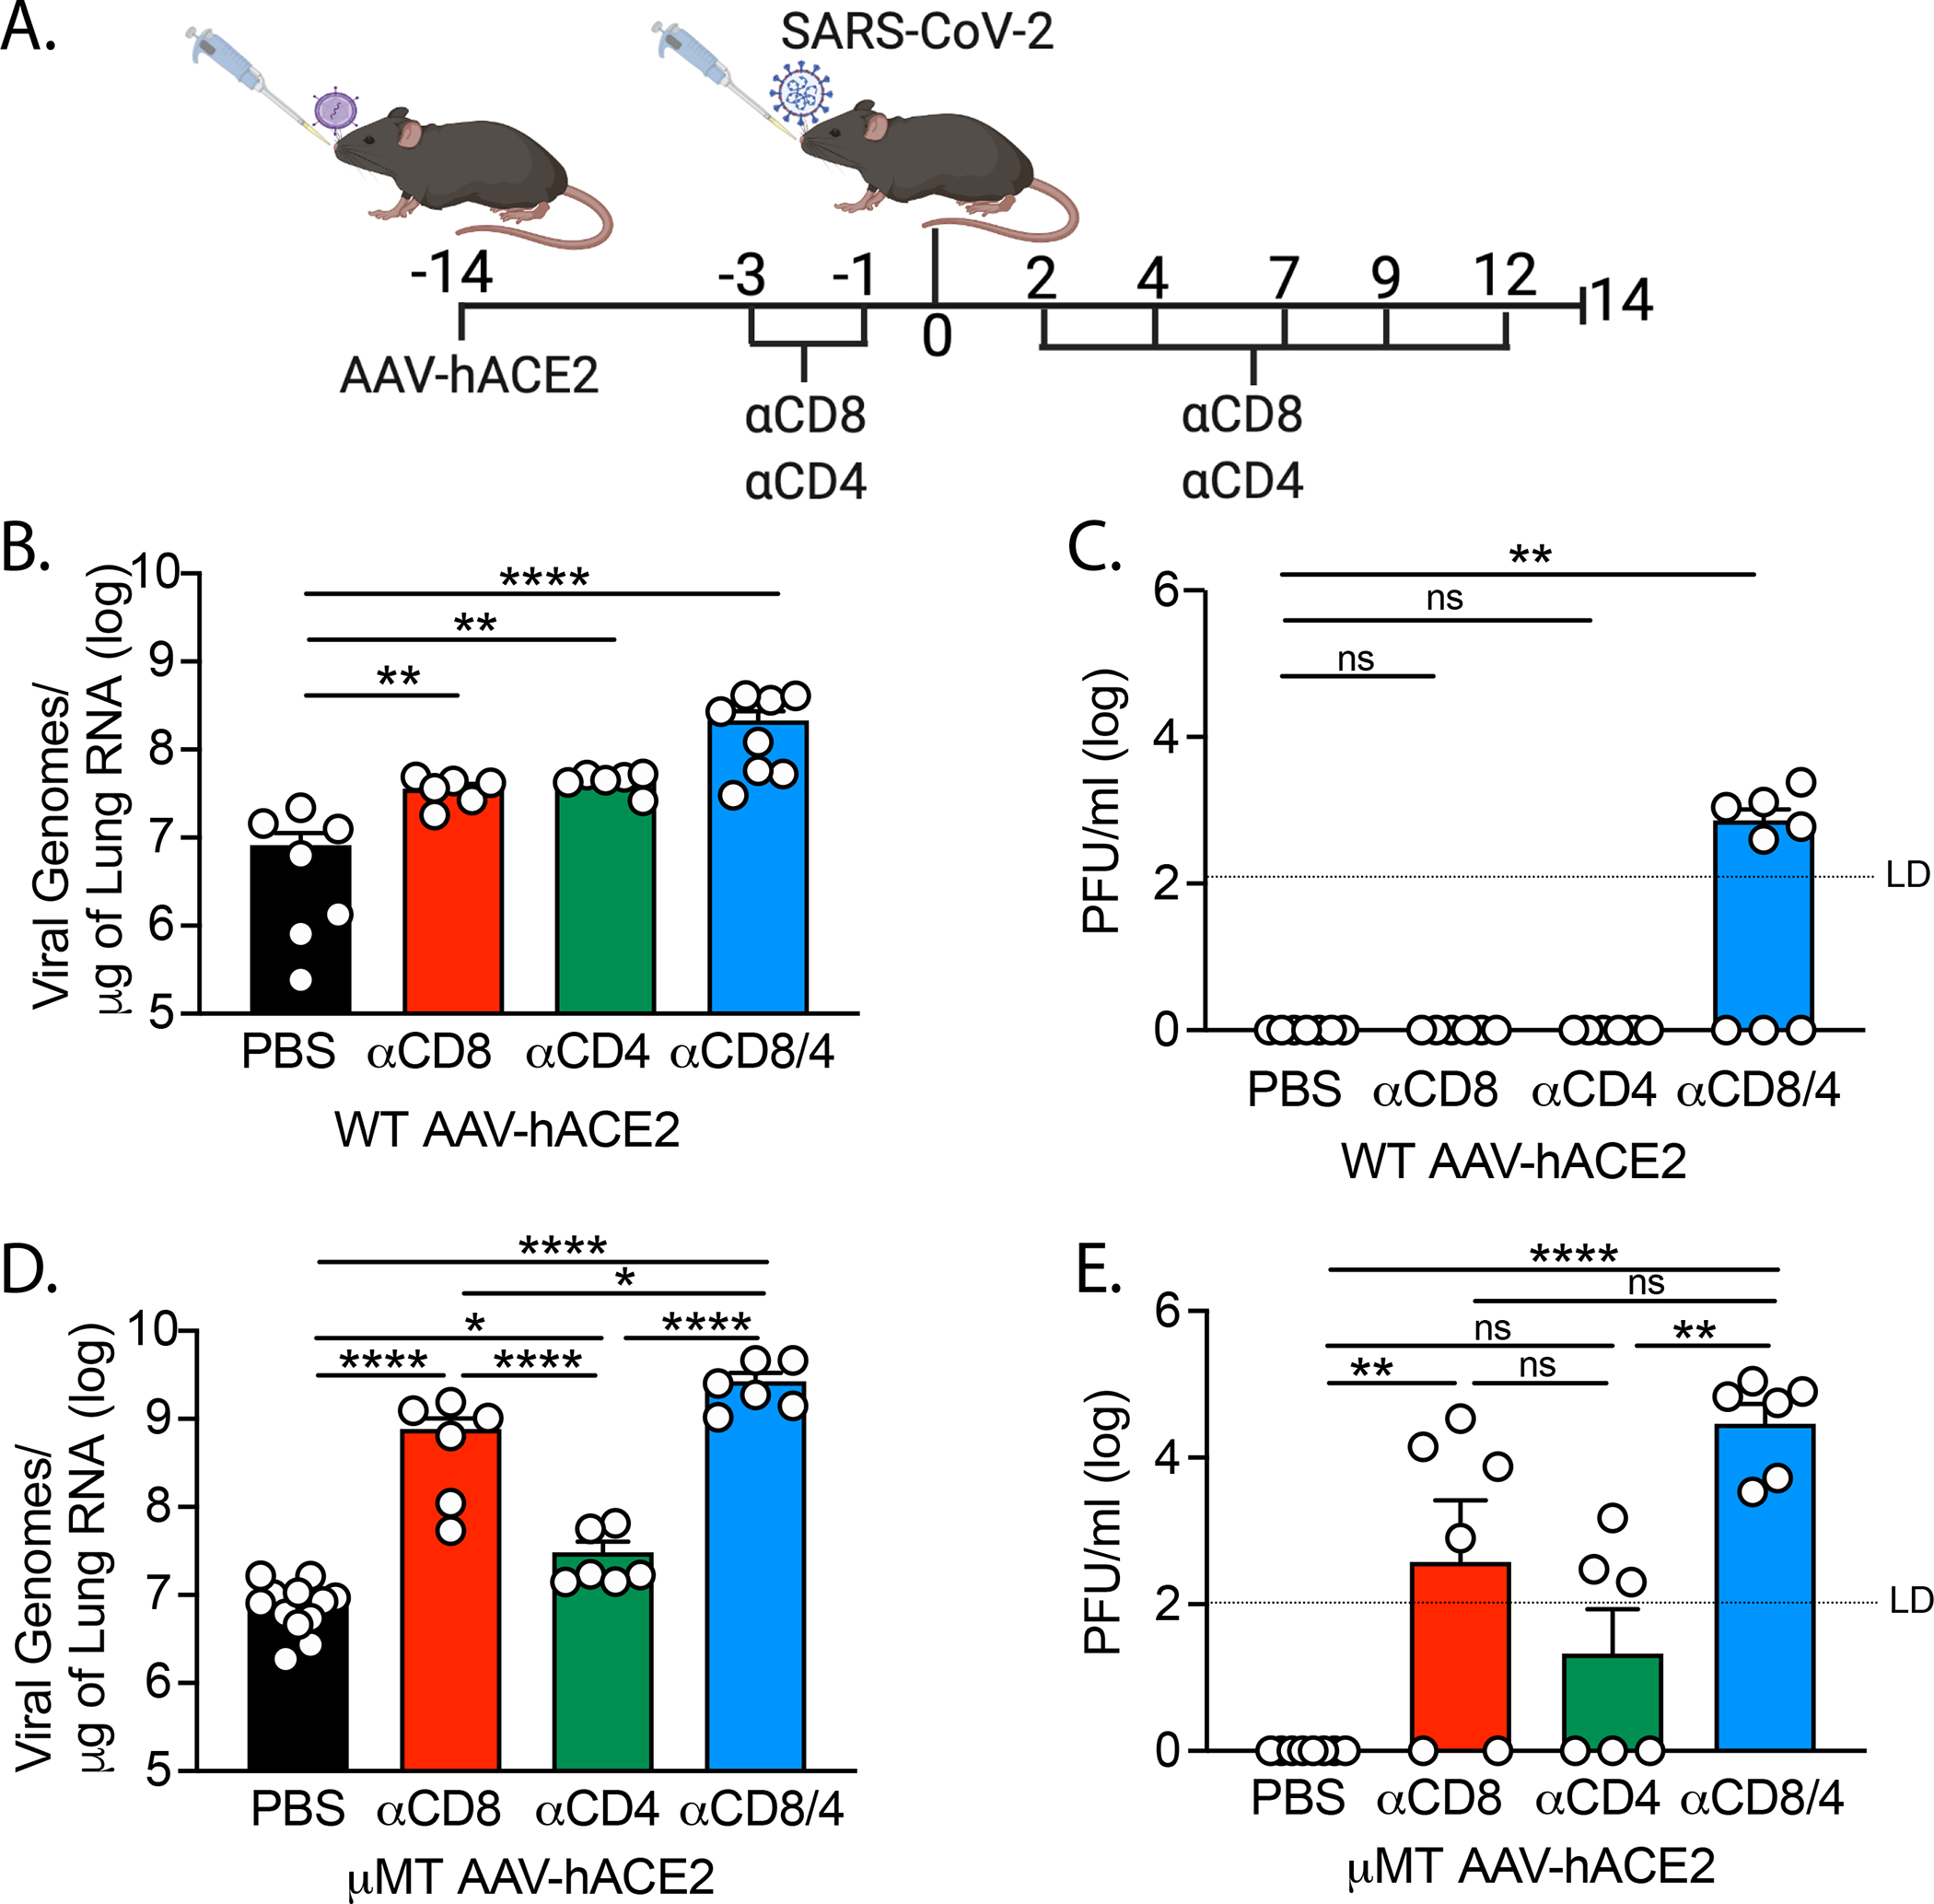
(A) Experimental design. AAV-hACE2 transduced WT (B, C) and μΜΤ (D, E) were injected (intraperitoneal) with 200mg anti-mouse CD8a (clone 2.43) or 200mg anti-mouse CD4 (clone GK1.5) starting at 3 days prior to infection and given every 2 to 3 days as indicated until 12 DPI. Mice were infected with WA1 strain SARS-CoV-2 at 106 PFU intranasally and lungs were collected at 14 DPI and assessed by quantitative PCR (B,D) and plaque assay (C,E). Individual values noted as dots and bars indicate mean ± SEM from 6–12 samples of two-three independent experiments. P values were calculated by one-way ANOVA with Tukey’s multiple comparison. *, P< 0.05; **, P < 0.01; ***, P < 0.001, ****, P < 0.001