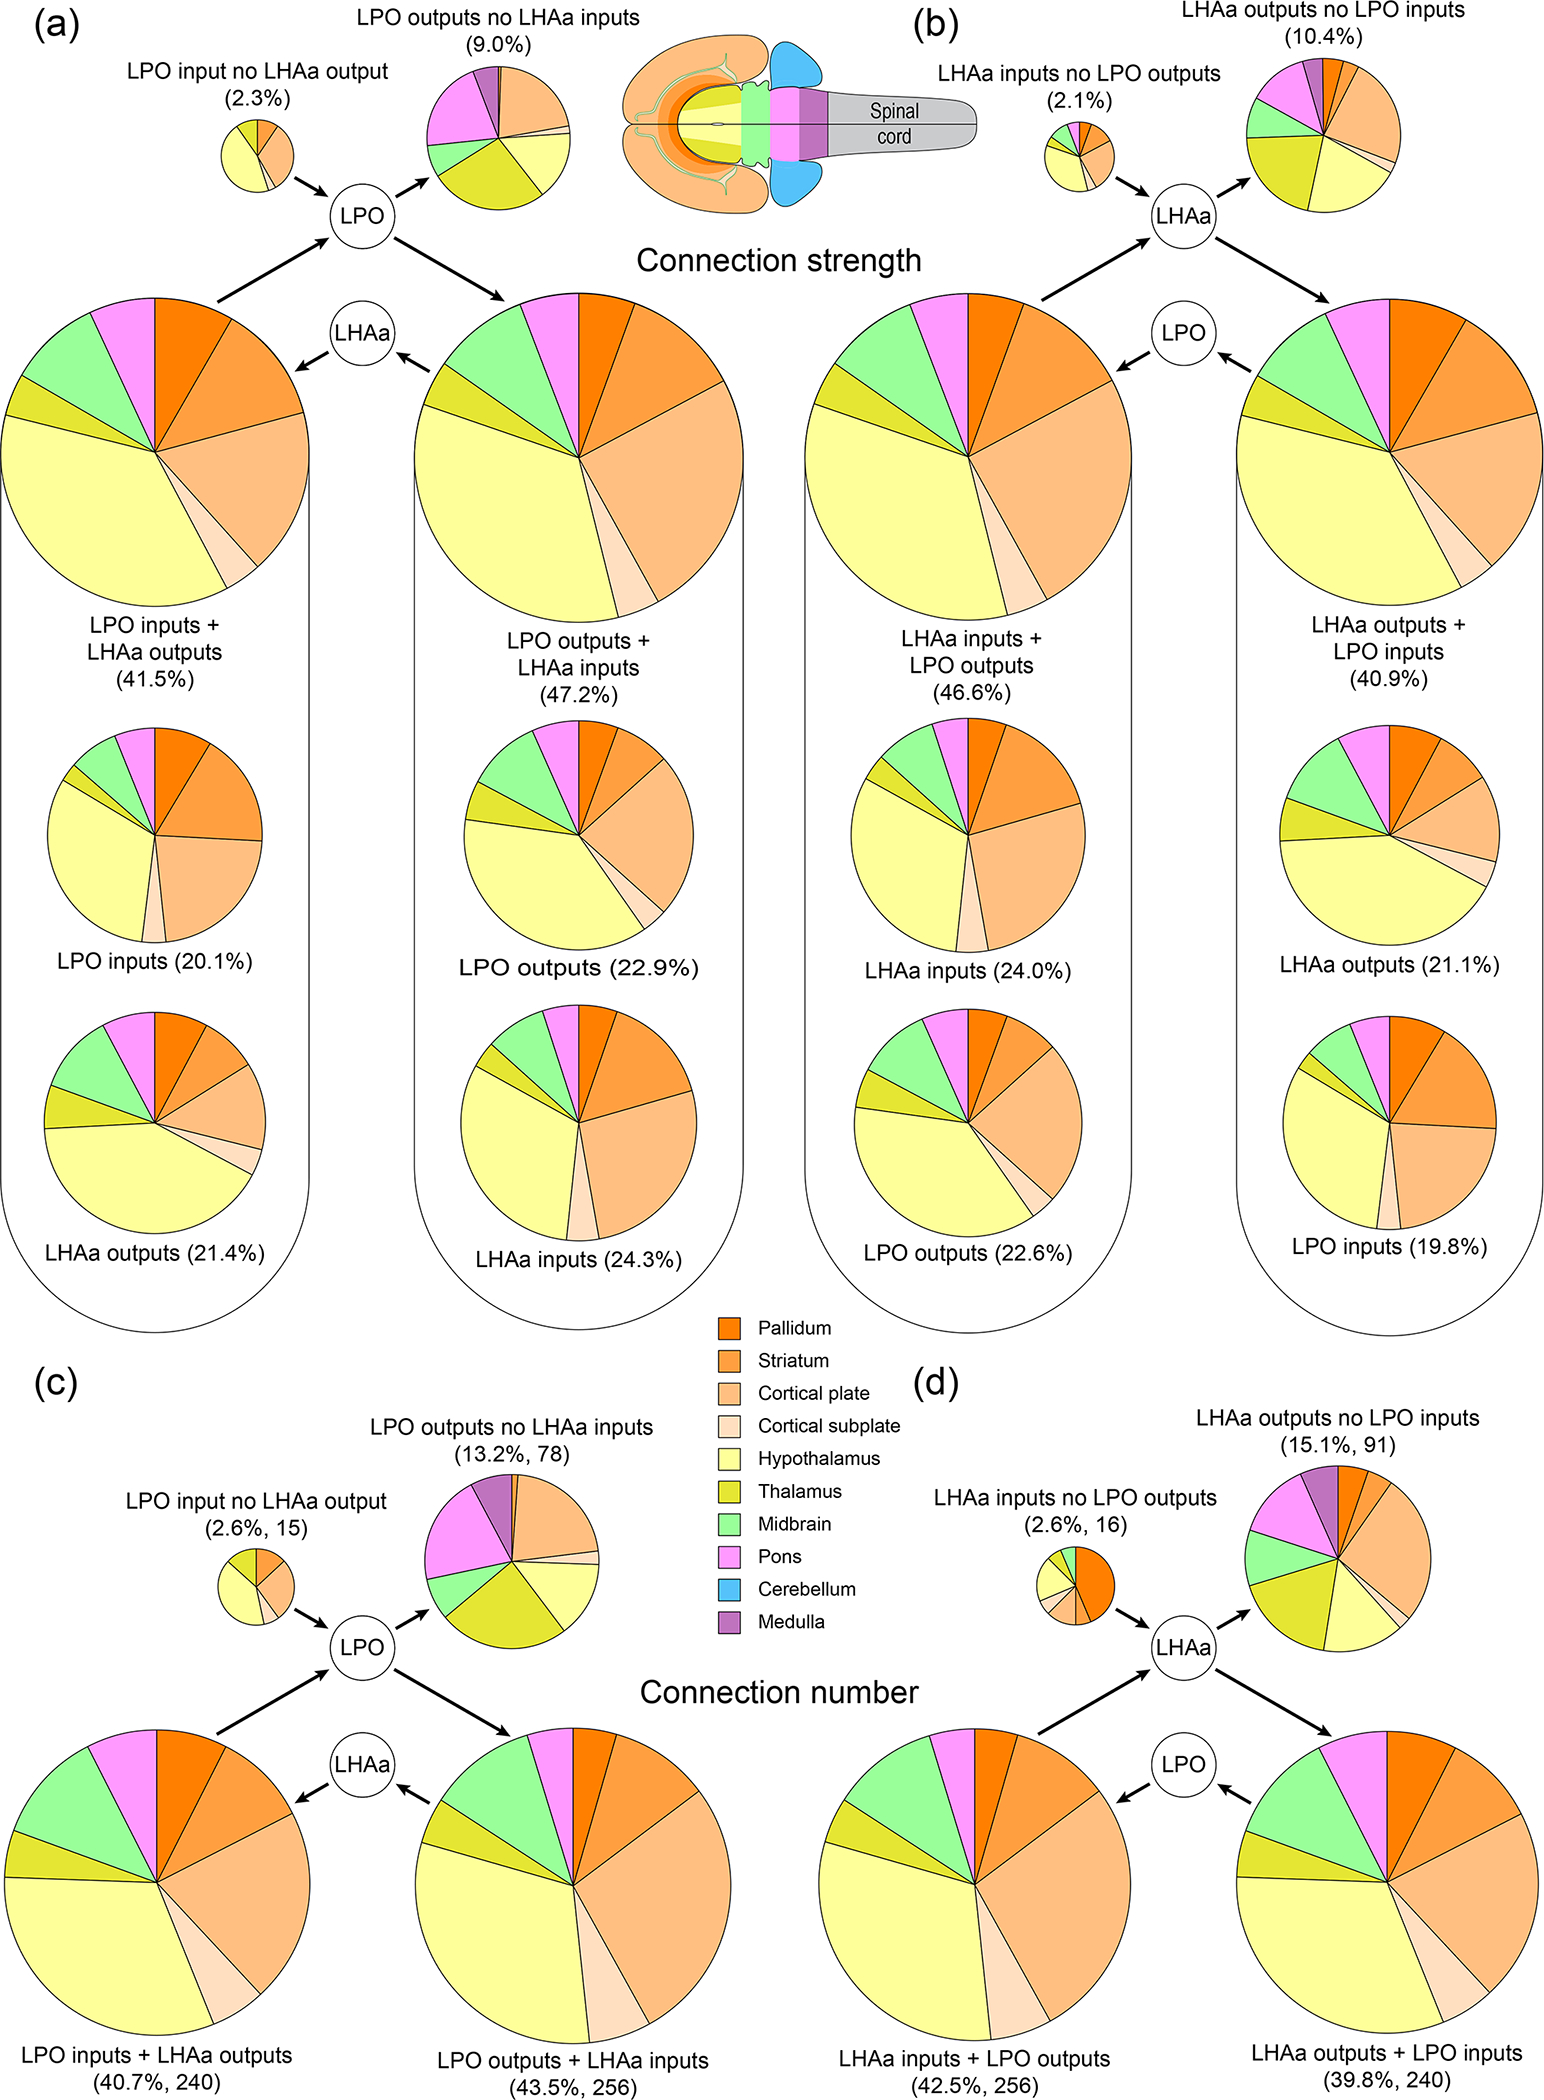
Figure 11.

Summary of LPO and LHAa combinatorial bidirectional connectivity with major brain divisions. The area of each pie chart (and their segments) is directly proportional to the percentage of each represented connection category for the LPO (a and c) and LHAa (b and d), as a proportion of either the total connection weight (as a sum of the average macroconnection weights) (a and b), or the total number of connections (c and d). For the bidirectional connection categories in (a) and (b), the proportional contribution of each connection subcategory (inputs and outputs) is also shown. Pie chart segment colors correspond to major brain divisions (flatmap and color key insets).
