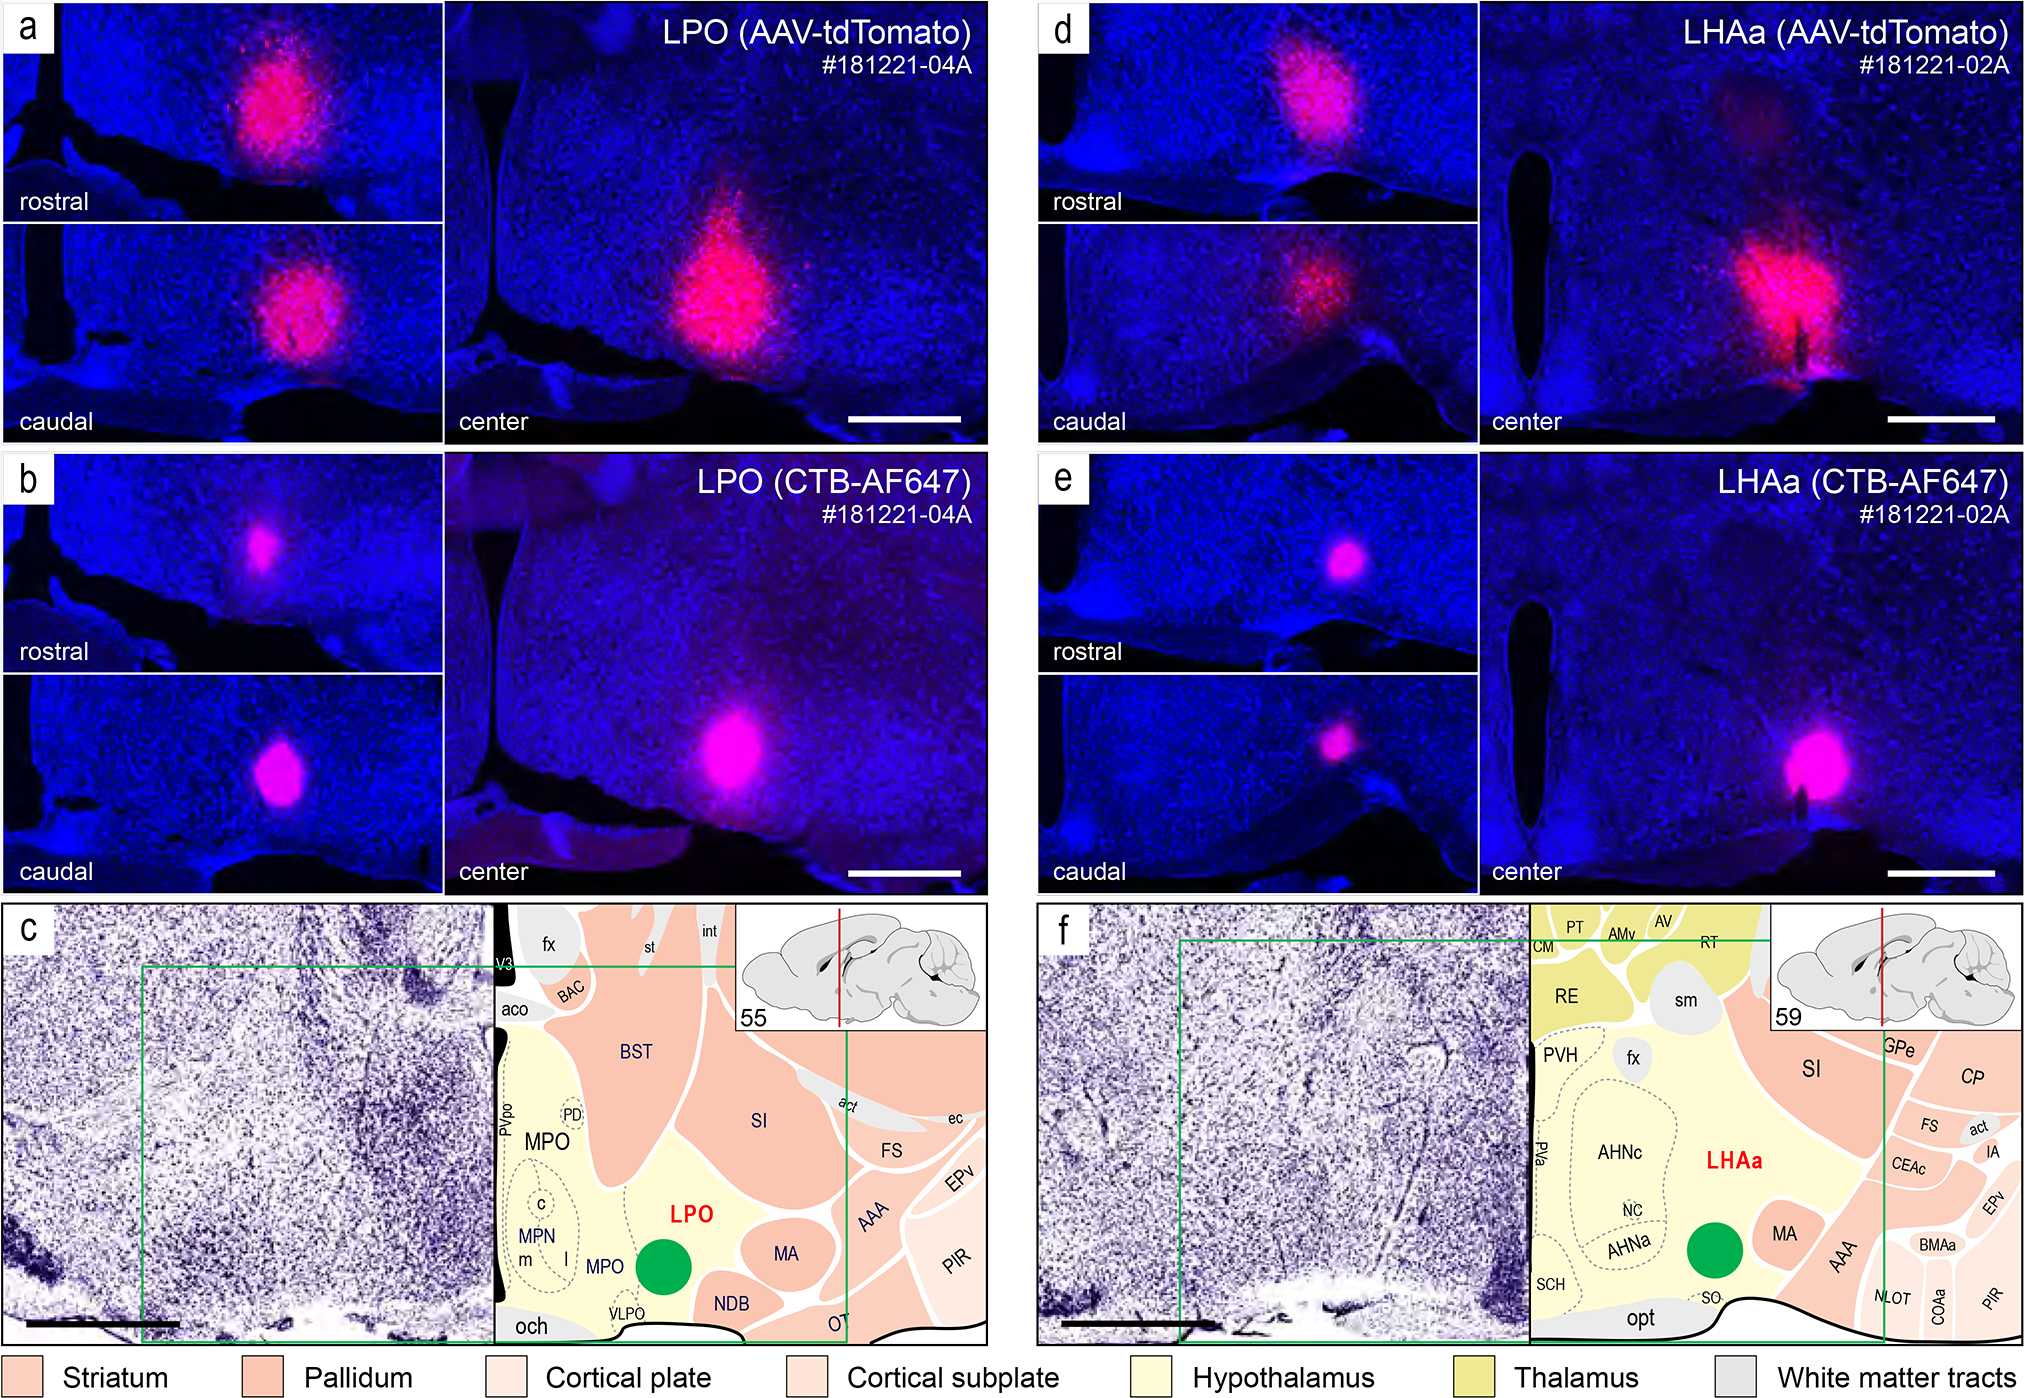
Figure 2.

Injection sites from two representative axonal tracing experiments (181221–04A [LPO], and 181221–02A [LHAa]) that were mostly restricted to a midventral part of the LPO (a-c) and LHAa (d-f). For each experiment, a combination of two axonal tracers was injected in series: AAV-tdTomato (a and d, red) and CTB-647 (b and e, pink). The tissue sections were counterstained with a fluorescent Nissl stain (see Methods for details) to facilitate mapping to a reference atlas (c and e, adapted from Dong, 2007). The atlas levels shown in c and e are the closest match for the center of the injection sites. The green box in c and e represents the approximate area of the corresponding images above, and the green discs represent the approximate location and local spread of the axonal tracers at the center of the injection sites. The left upper and left lower images in a, b, d, e show spread of the tracers rostral (upper left) and caudal (lower left) within the LPO (a and b) and LHAa (c and e) from the center of the corresponding injection sites. Scale bars are 500 μm. For abbreviations see Supporting Information 1.
