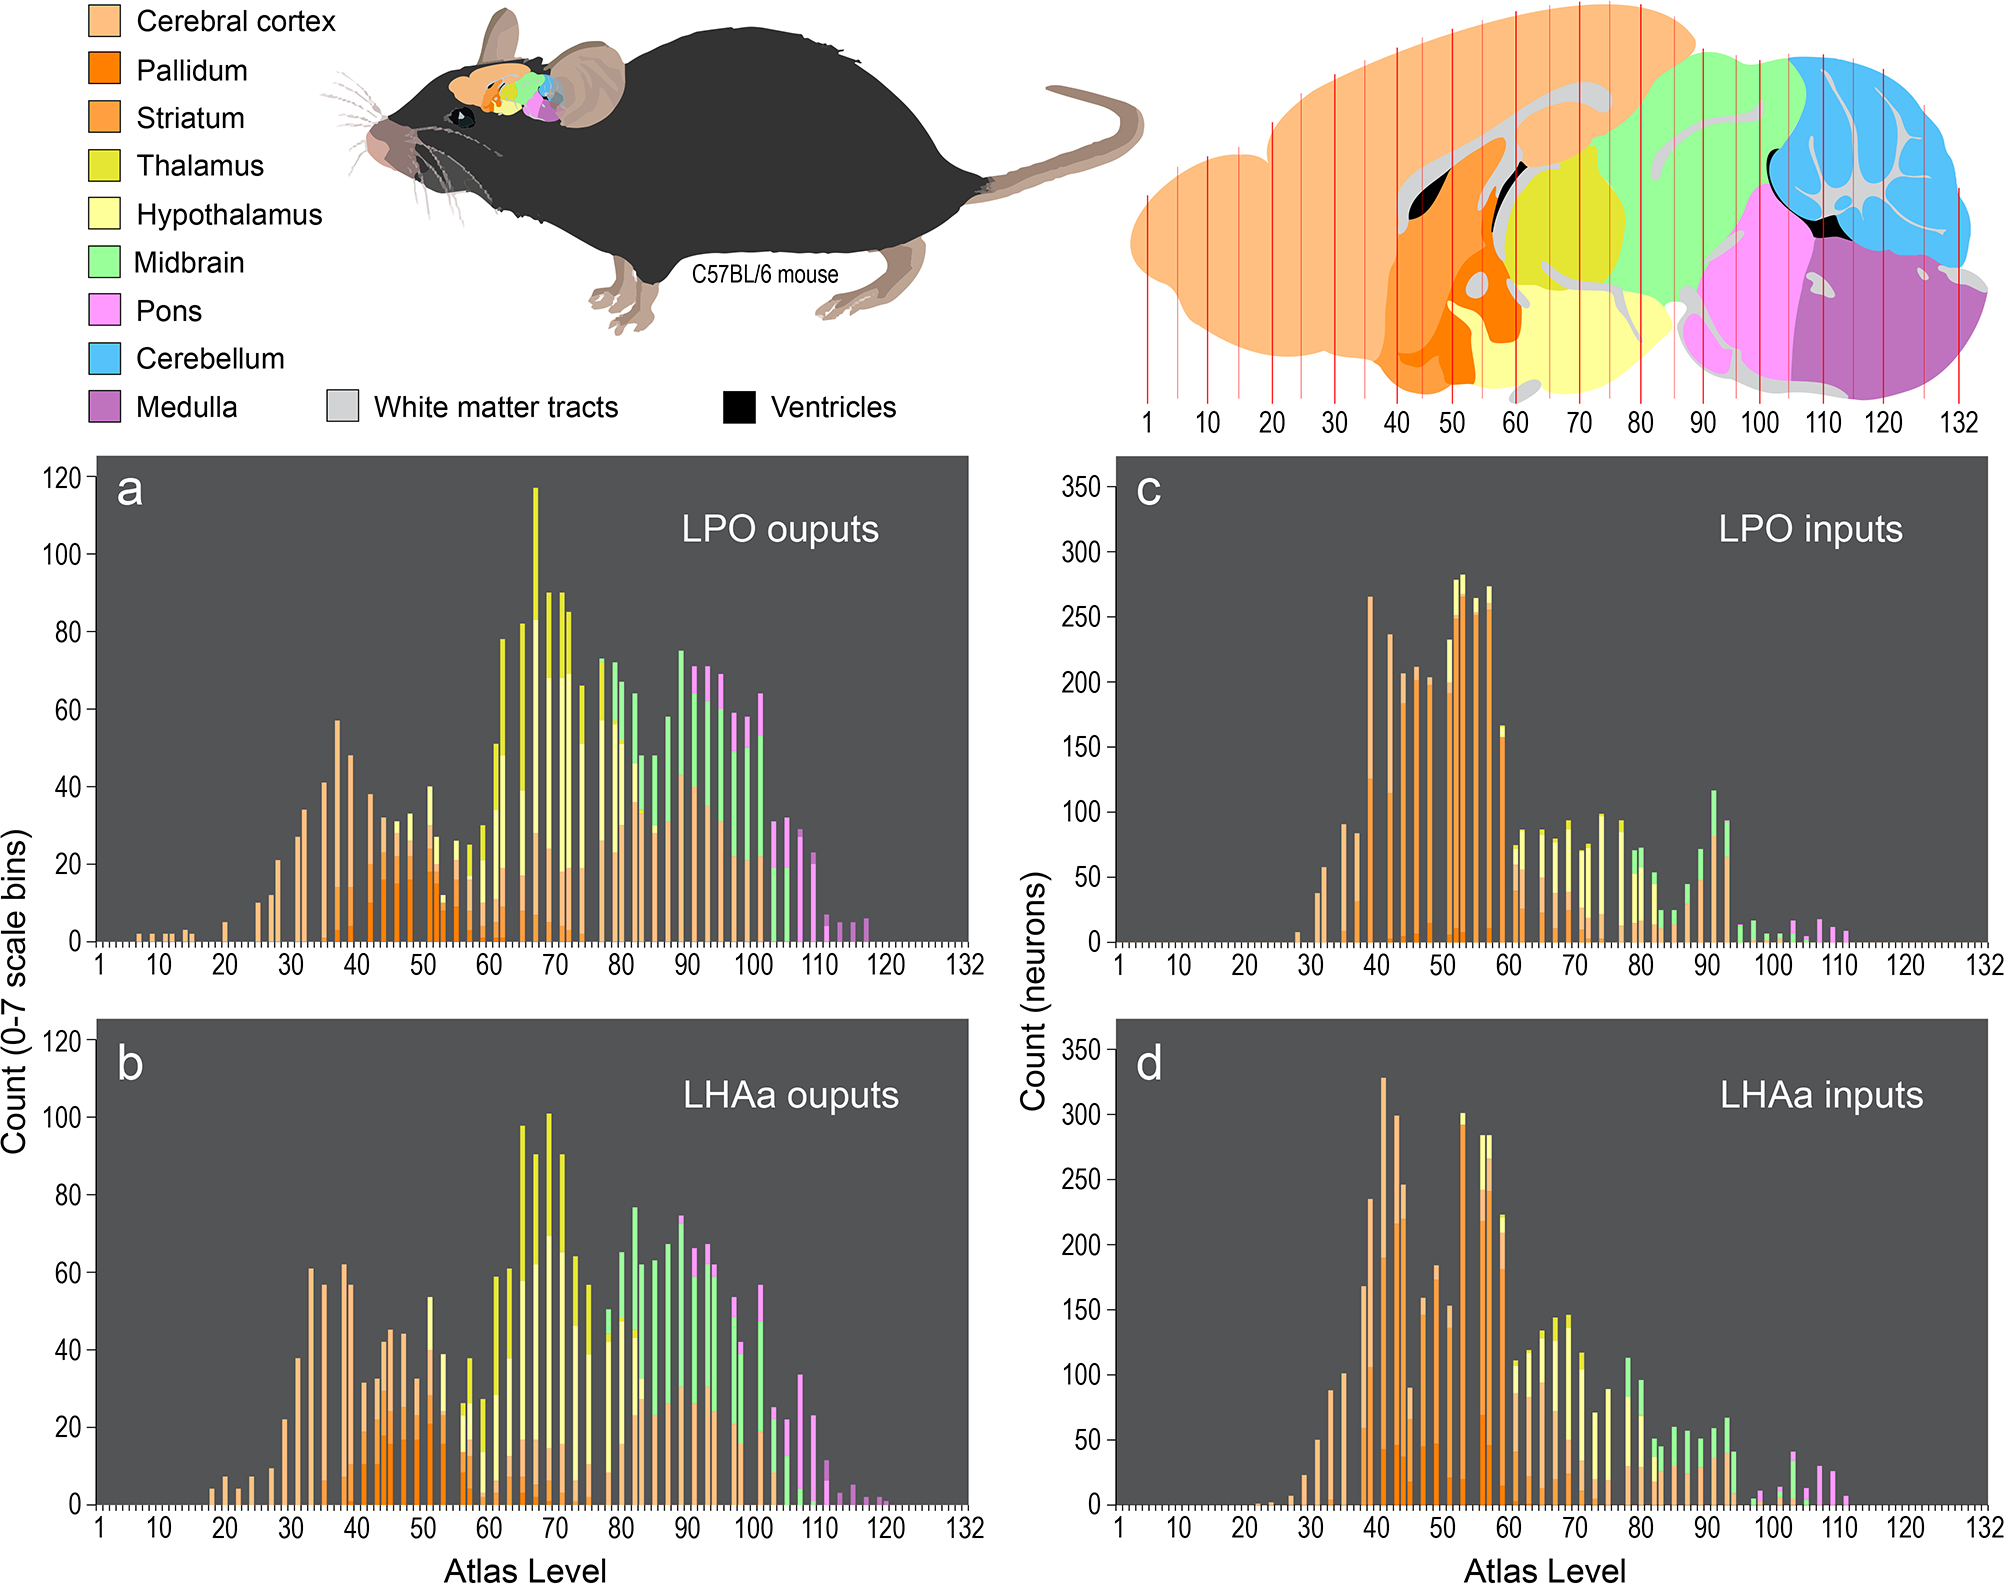
Figure 4.

Rostral to caudal distribution and connection weights of LPO and LHAa macroconnections for major brain divisions. The four bar charts (a-d) show for 9 major brain divisions (encompassing the whole brain except for the spinal cord) the relative weight of LPO (a, c) and LHAa (b, d) macroconnection outputs (a, b; anterograde tracing) and inputs (c, d; retrograde tracing) ipsilateral to tracer injection sites for two representative experiments (#181221–04A [LPO], #181221–02A [LHAa]). Each staked bar represents an individual mouse brain reference atlas level (x-axis), and the relative proportion of major brain division connectivity for each atlas level is indicated by the length of the differently colored stacked segments (arranged topographically) that compose each bar. For output connections, the y-axis represents the total count of retrogradely labeled neurons for each atlas level; for input connections, the y-axis represents the sum of connection weights for each atlas level (using an ordinal scale (0–7) representing relative labeling abundance from absent (0) to very strong (7) [see Methods for further detail]). The color scheme applied to the major brain divisions (color key top left) is also applied to a parasagittal schematic (top right) showing the general rostral-caudal topography of the 9 major brain across the reference atlas levels; the same schematic is scaled and oriented to show the approximate position and relative size of the mouse brain within the mouse (top middle).
