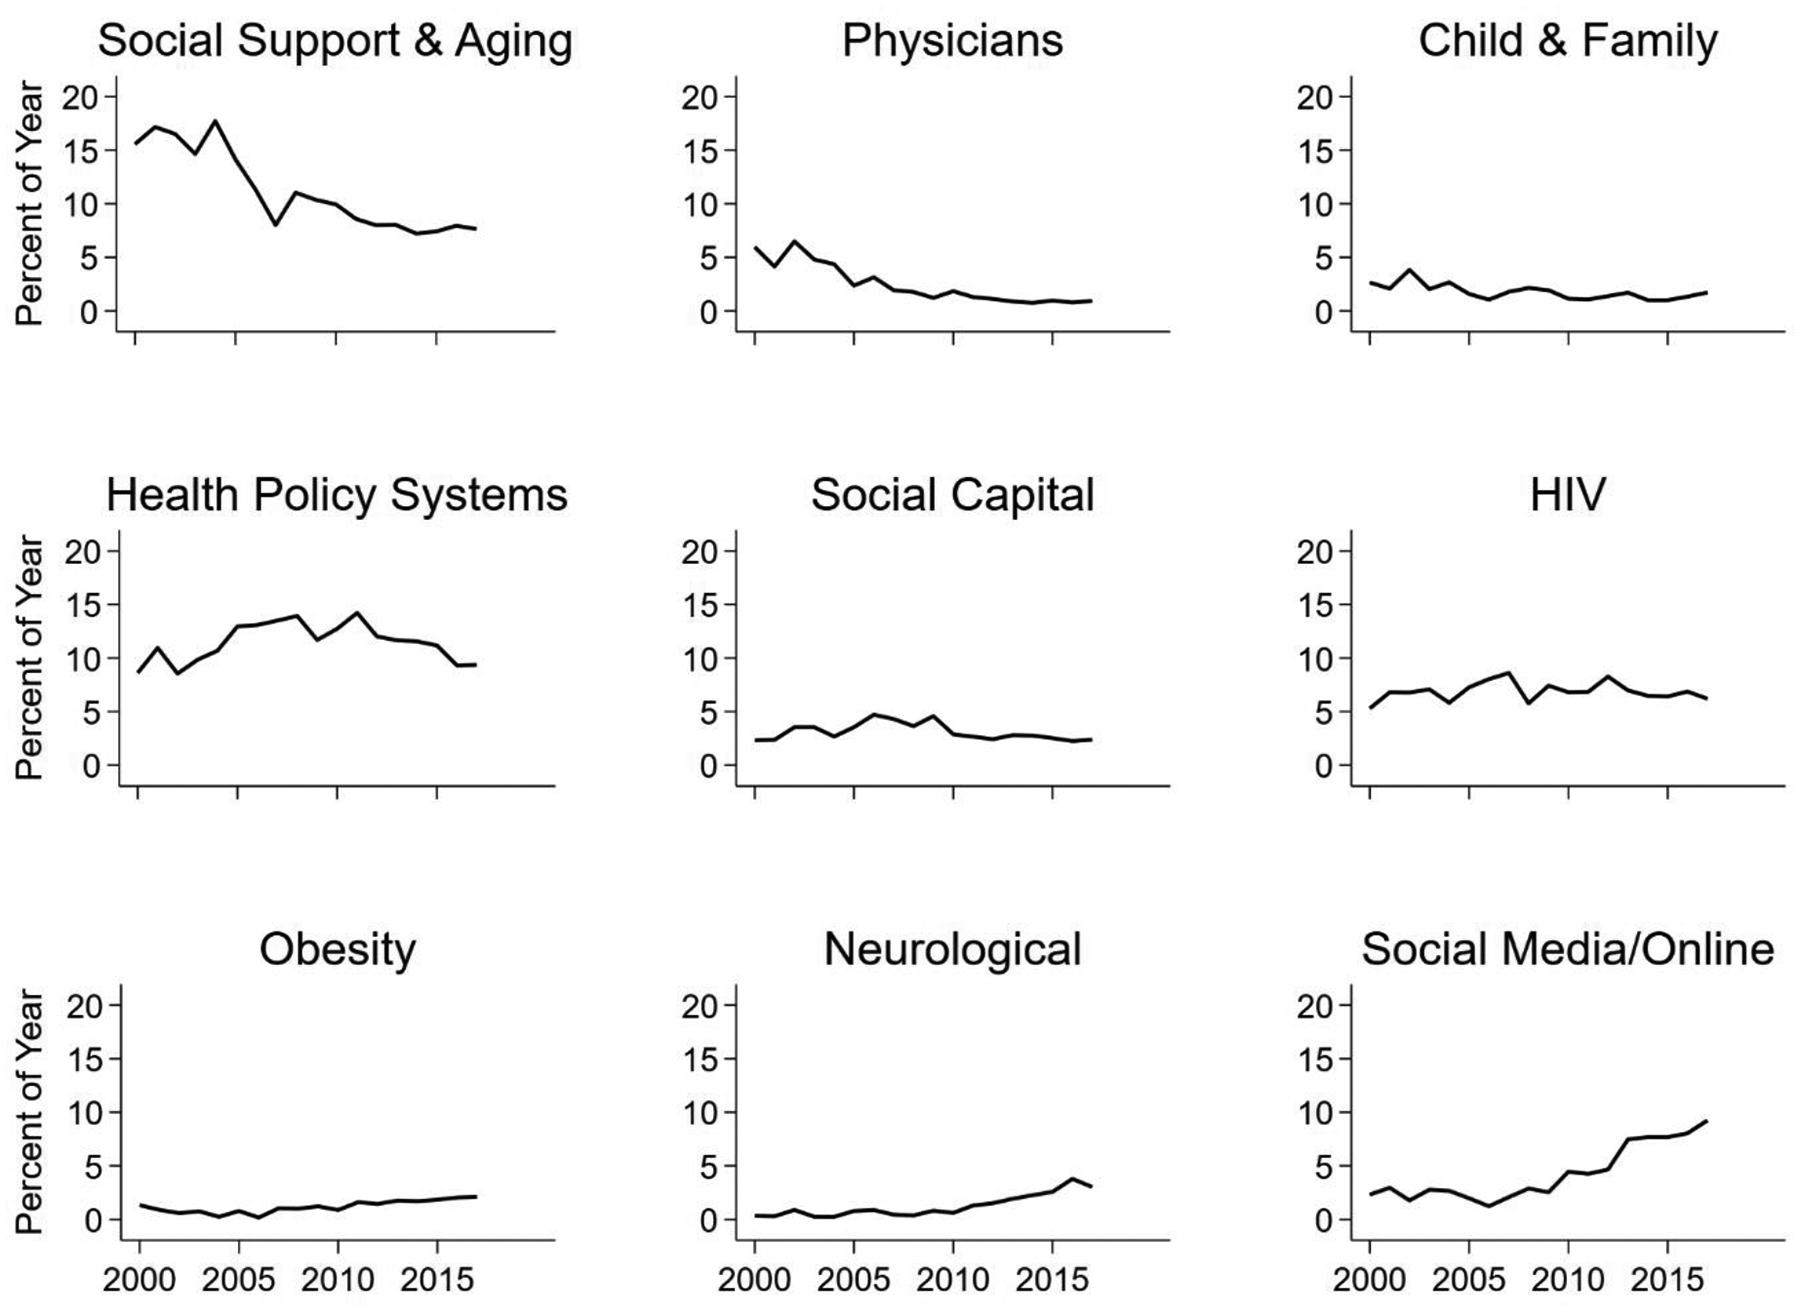
Figure 6:

Publication volume trends in social networks and health since 2000.
Note. This figure shows the percent of articles published in each of the nine largest substantive areas defined via the clusters in Figures 4 and 5 in each year, allowing us to track the growth and decline of core topics in social networks and health. Within each year, the sum of all topics add to 100%, though these nine largest topics overall do not; smaller topics comprise the remainder.
