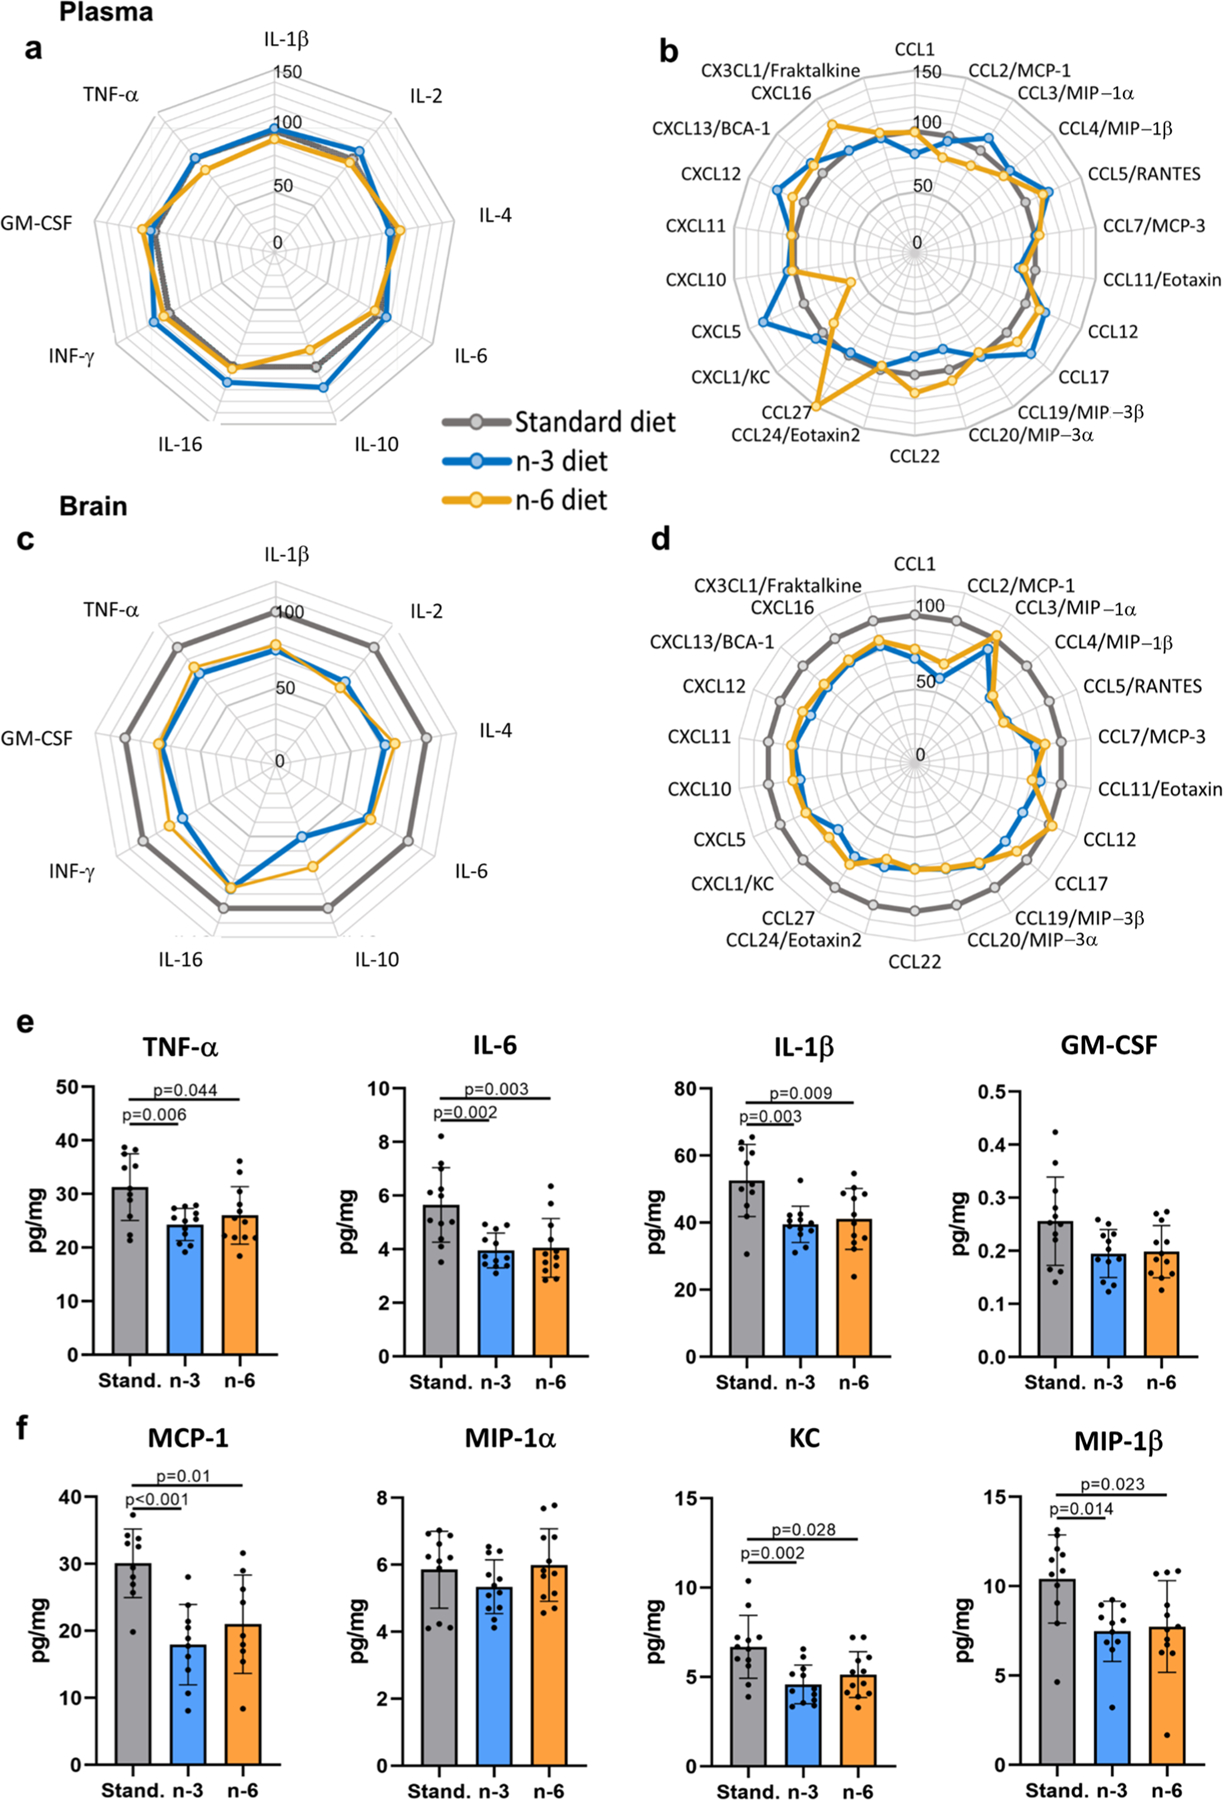
Fig. 4.

Cytokines and chemokines in blood and brain of offspring. Radar charts showing blood plasma levels of cytokines (a) and chemokines (b) and brain levels of cytokines (c) and chemokines (d) in pups born to mothers fed a n-3 (blue line) or n-6 (yellow line) enriched diet in relation to levels in the tissues of pups whose mothers were fed standard diet (grey line, level set to 100%). Levels of specific cytokines (e) and chemokines (f) in the brain of offspring from mothers fed a standard (grey), n-3 enriched (blue) or a n-6 enriched (yellow) diet. Data presented as mean ± SD. One-way ANOVA with post-hoc Tukey’s multiple comparison test was performed to compare groups. Individual p-values are listed within figures for data that are significantly different. N = 10–12/diet
