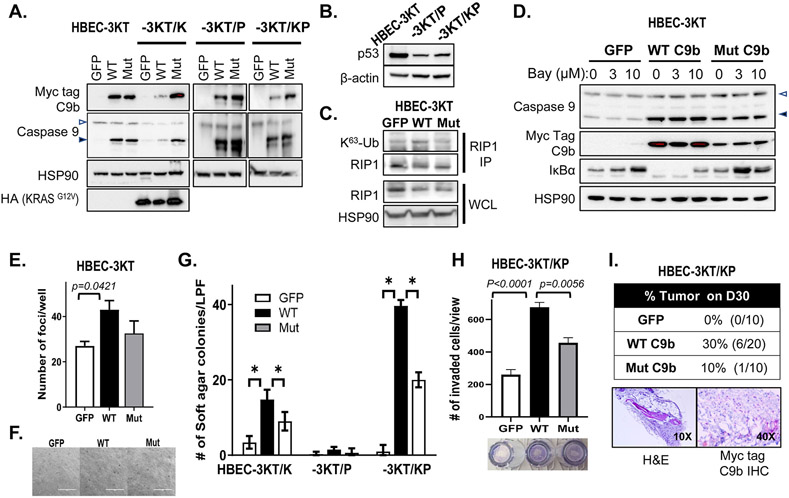
Figure 1. C9b activates NF-κB in HBEC-3KT cells and cooperates with KRAS activation and p53 loss driving anchorage independent growth (AIG) and invasion in vitro and tumor growth in vivo.
A-D. Western blot analyses with indicated antibodies of HBEC-3KT, −3KT/K (KRASG12V), −3KT/P (shTP53), and −3KT/KP cells expressing GFP, wild type (WT), or AT/GG mutant (Mut) C9b (with a Myc-tag). C. RIP1 immunoprecipitation (IP) followed by immunoblotting with K63-Ub antibody shows increased RIP1 K63-Ub by WT C9b in HBEC-3KT cells (in growth supplement free media). In D, HBEC-3KT cells were treated with 0, 3, 10 μM Bay 11-7082 for 15 h. WCL: whole cell lysates. The empty and filled triangles denote C9a and C9b proteins, respectively. E. Clonogenic assays of parental HBEC-3KT cells expressing GFP, WT, or Mut C9b. The graph shows numbers of clonal foci per well on D10. F. Bright field images (10x) of HBEC-3KT cells expressing GFP, WT, or Mut C9b grown in soft agar on D45. G. Number of colonies per low power filed (LPF) view grown in soft agar on D45 (*: p≤0.0002). H. Number of invaded HBEC-3KT/KP cells expressing GFP, WT, or Mut C9b through Matrigel at 22 h per LPF view. I. SCID Tumor take rate of HBEC-3KT/KP cells expressing GFP, WT, or Mut C9b on day 30 post implantation (top) and H&E, Myc-tag, and c-Myc IHC images (bottom panels). Data are means ± SD; n = 3 each. Adjusted p values are determined by ANOVA Tukey’s multiple comparison test.

