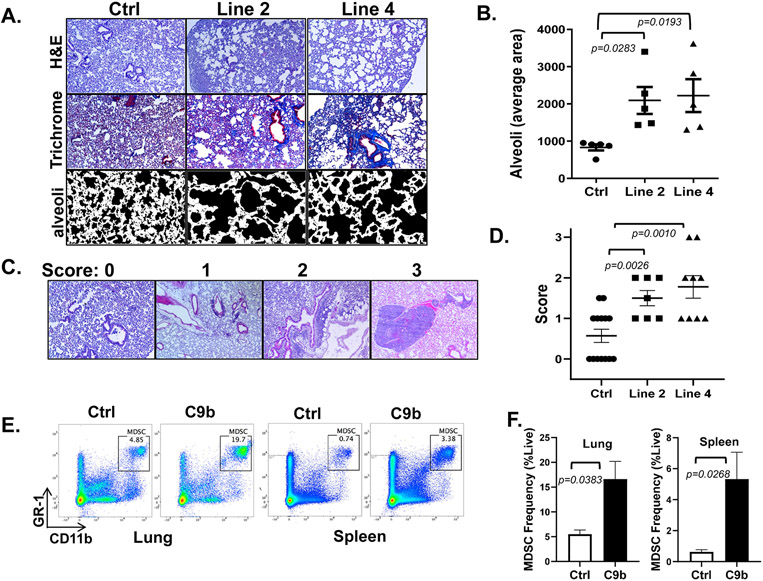
Figure. 3. Lungs of C9b mice show emphysema, fibrosis, and immune infiltration.
A. H&E and trichrome staining show enlarged alveoli and increased peribronchovascular collagen deposits in line 2 and line 4 mice compared to control. Average area of alveoli (B, n=5 per group) is measured using Image J from trichrome stained slides avoiding large vessels and bronchi (A, bottom row). C,D. Scoring systems for immune aggregates and infiltrates (C, 10X) and average lung inflammation score for each group (n=14 for control, 7 for line 2, and 9 for line 4 mice, D). E, F. Increased % of MDSCs (Gr1+/CD11b+) in lung and spleen of C9b mice (n=3) compared to Control (n=3) by FACS analysis. Data are means ± SEM. Adjusted p values are determined by ANOVA Tukey’s multiple comparison test for B&D and by unpaired t-test for F.

