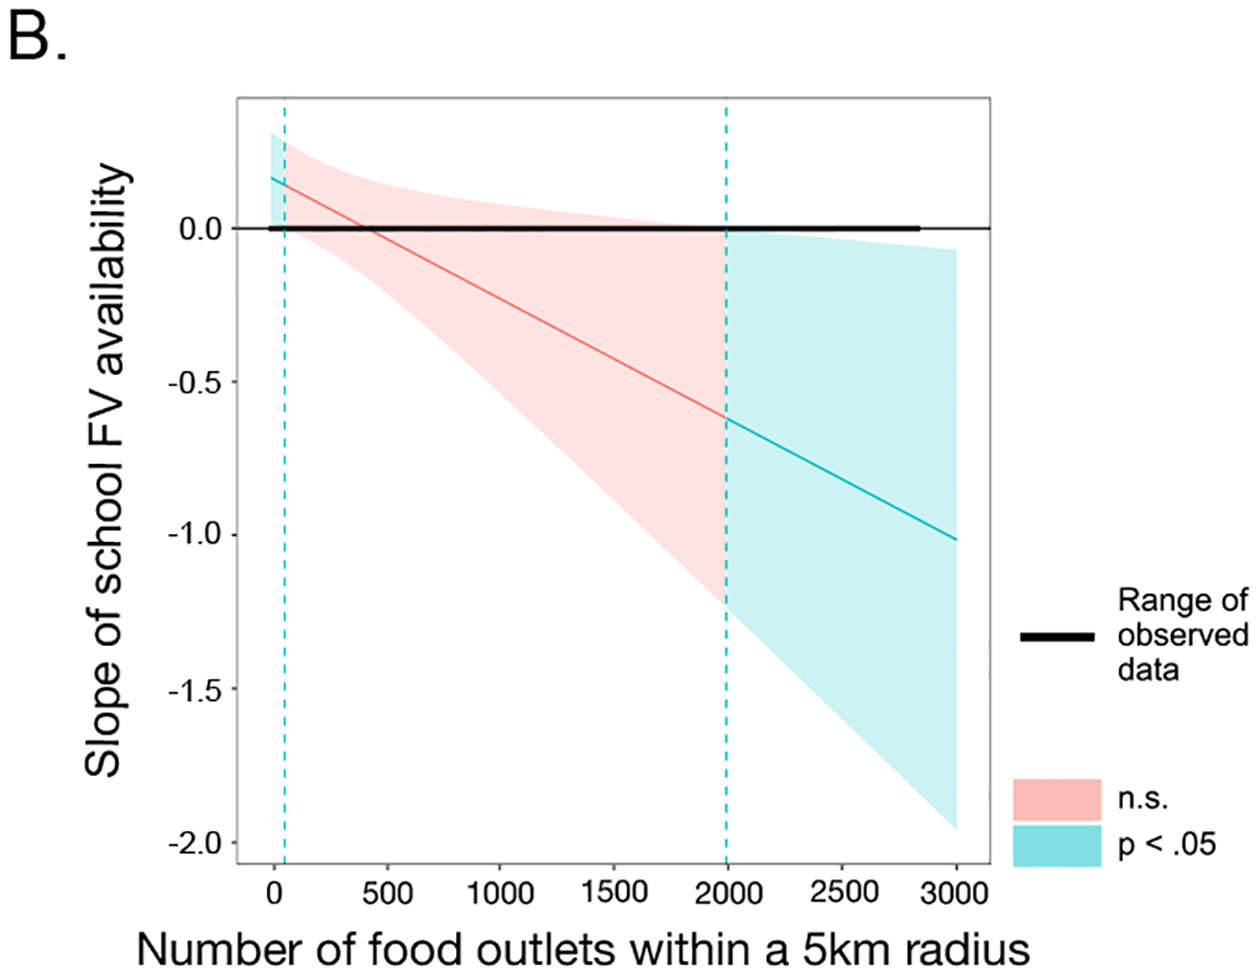
FIGURE 1B:

Johnson-Neyman regions of significance and confidence bands (95% CI) for the conditional relation between school FV availability and student FV intake as a function of all food outlets within 5 km of schools. Blue shaded areas reflect regions of significance ([0,58.9] and [>1990.2]) and the bold horizontal line indicates the range of observed food outlets in the sample data [0,2828]. When the number of food outlets is between 0 and 58 and 1991 and higher, the slope of school FV availability is p < 0.05.
