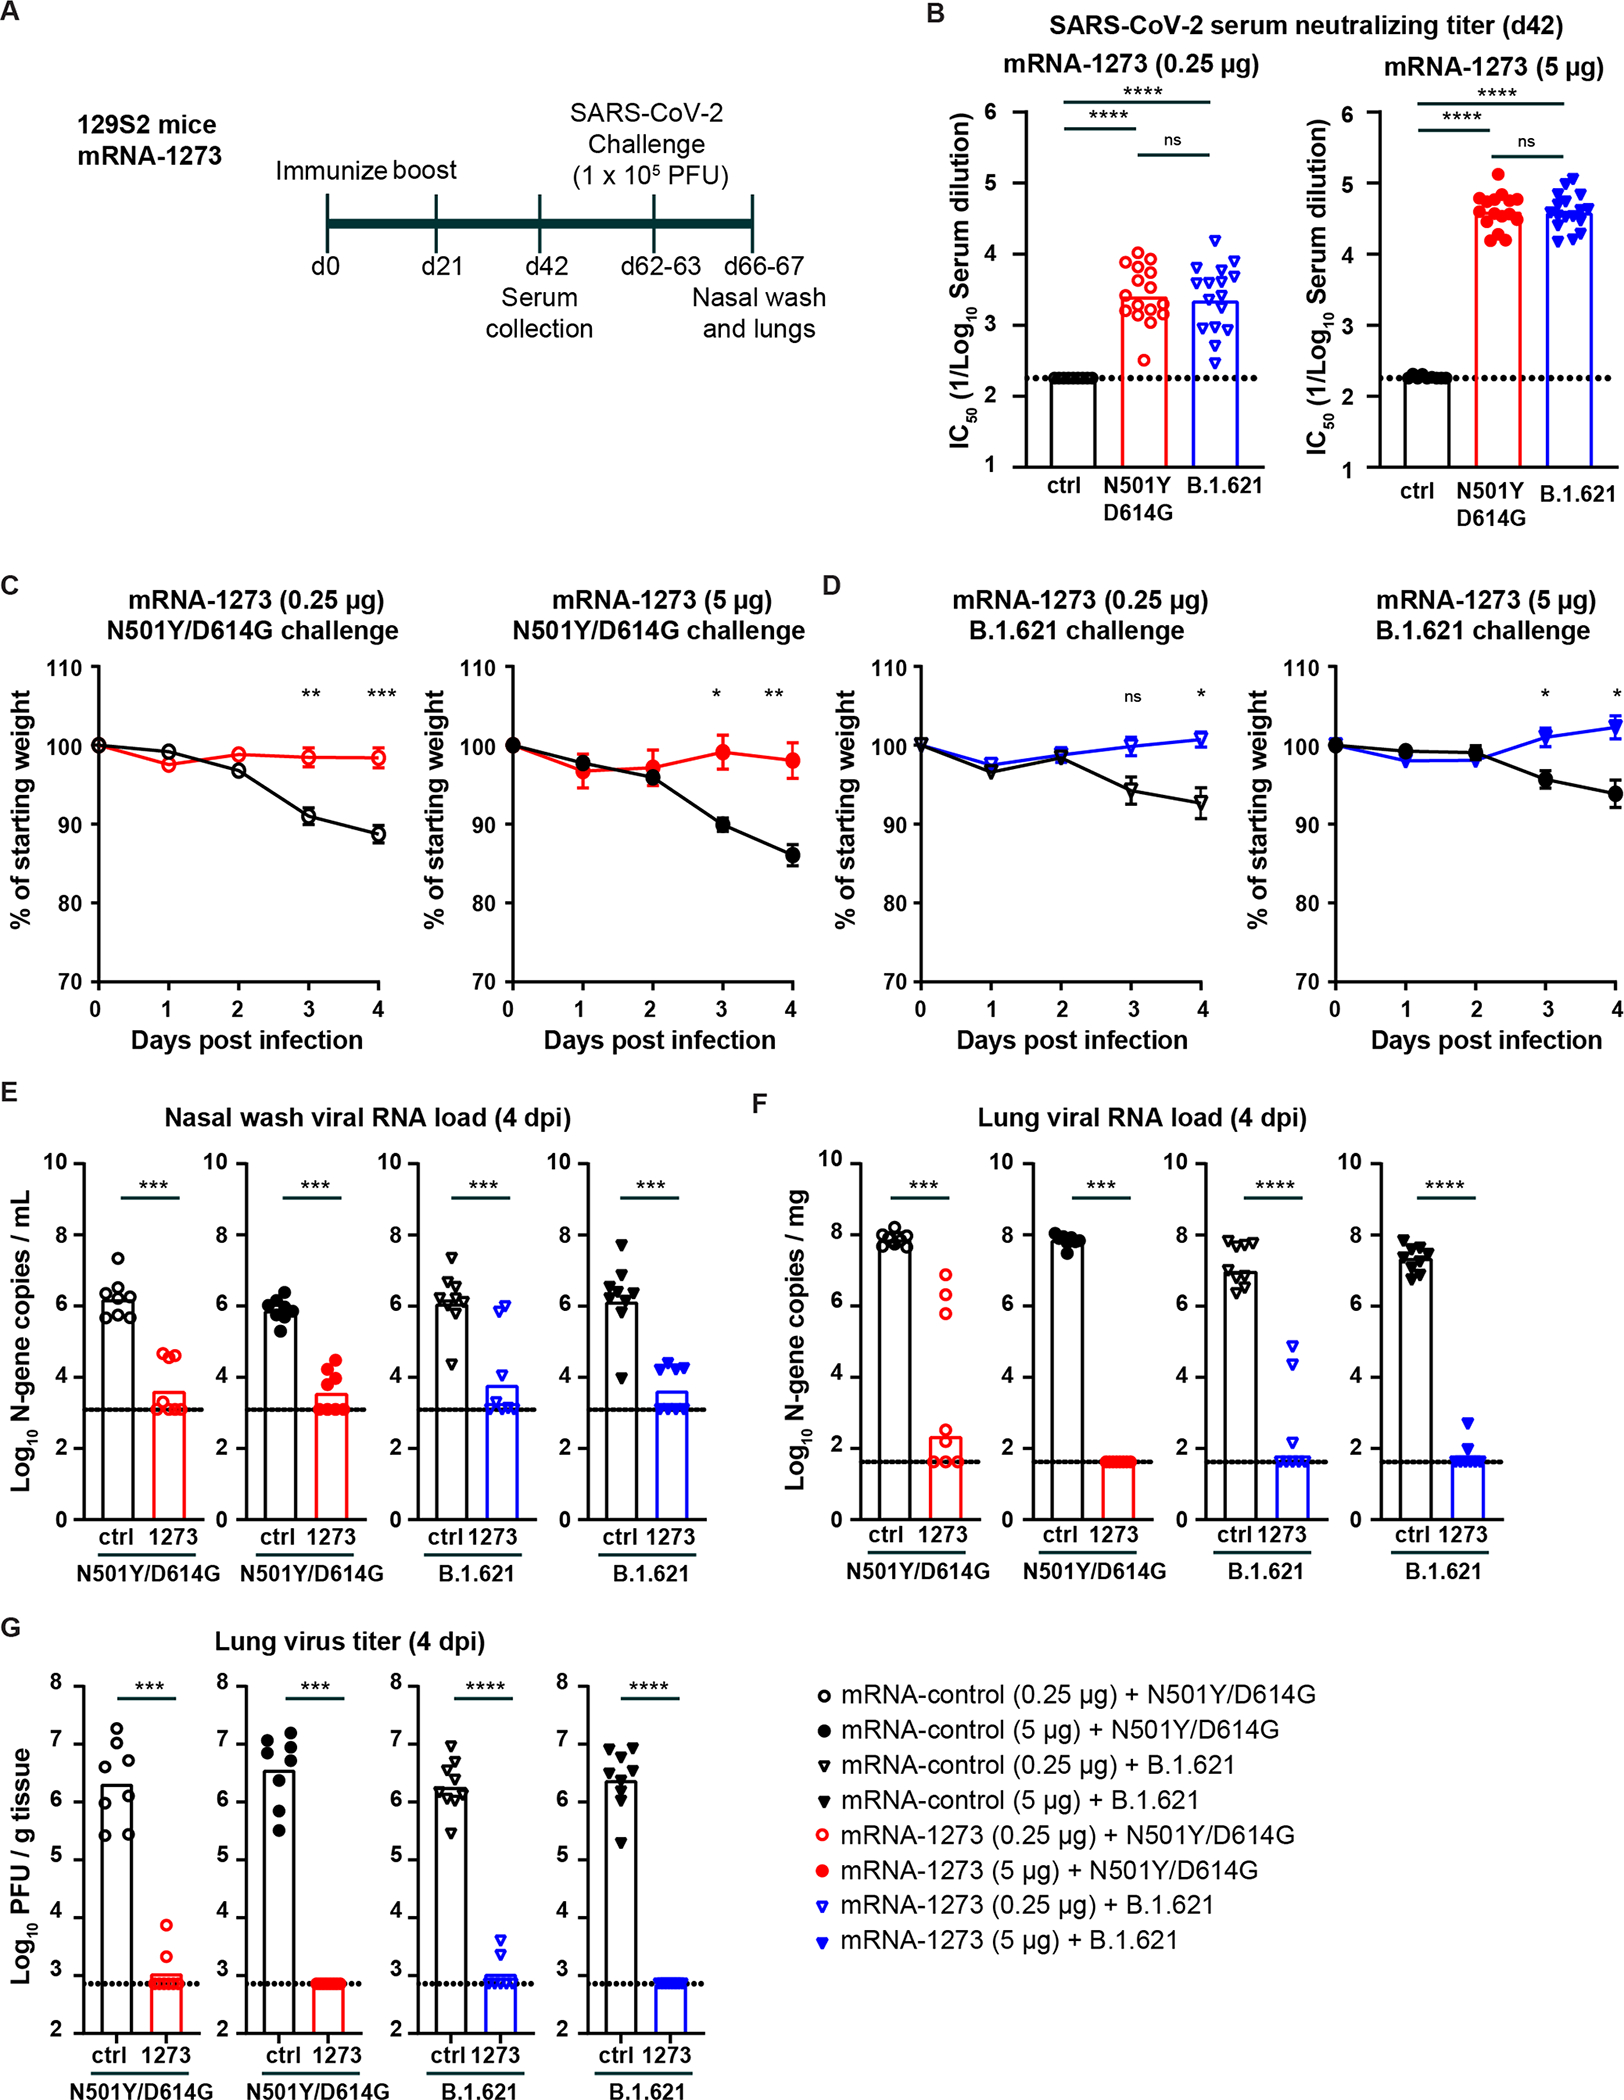
Figure 3. mRNA-1273 protects 129S2 mice against challenge with WA1/2020 N501Y/D614G and B.1.621.

(A) Experimental setup. (B) Serum neutralizing titer (IC50) against WA1/2020 N501Y/D614G (red circles) or B.1.621 (blue triangles) from 129S2 mice immunized twice with 0.25 μg (open symbols) or 5 μg (closed symbols) of mRNA-1273 or mRNA control vaccine. (**** P < 0.0001, *** P < 0.001 by non-parametric one-way ANOVA with a Dunn’s post-test). (C-D) Mean ± SEM of weight loss/gain in SARS-CoV-2 challenged mice (** P < 0.01, * P < 0.05, ns = not significant by two-way ANOVA). (E-G) 129S2 mice were challenged with 105 PFU of WA1/2020 N501Y/D614G (red symbols) or B.1.621 (blue symbols), and nasal washes (E) and lungs (F-G) were evaluated for viral RNA levels by RT-qPCR (E) and infectious virus by plaque assay (F-G) (**** P < 0.0001, *** P < 0.001, ** P < 0.01, * P < 0.05, ns = not significant by Mann-Whitney test). (B, E-G) Bars indicate the geometric mean values, and dotted lines are the LOD of the assays. Animals at the limit of detection are arbitrarily assigned this value. These values are combined with those having values above the limit to determine the GMT. The results are from two independent experiments, and each symbol represents an individual animals. See also Figure S1 and S3.
