
Figure 2: Example of biventricular function analysis via cine CT.
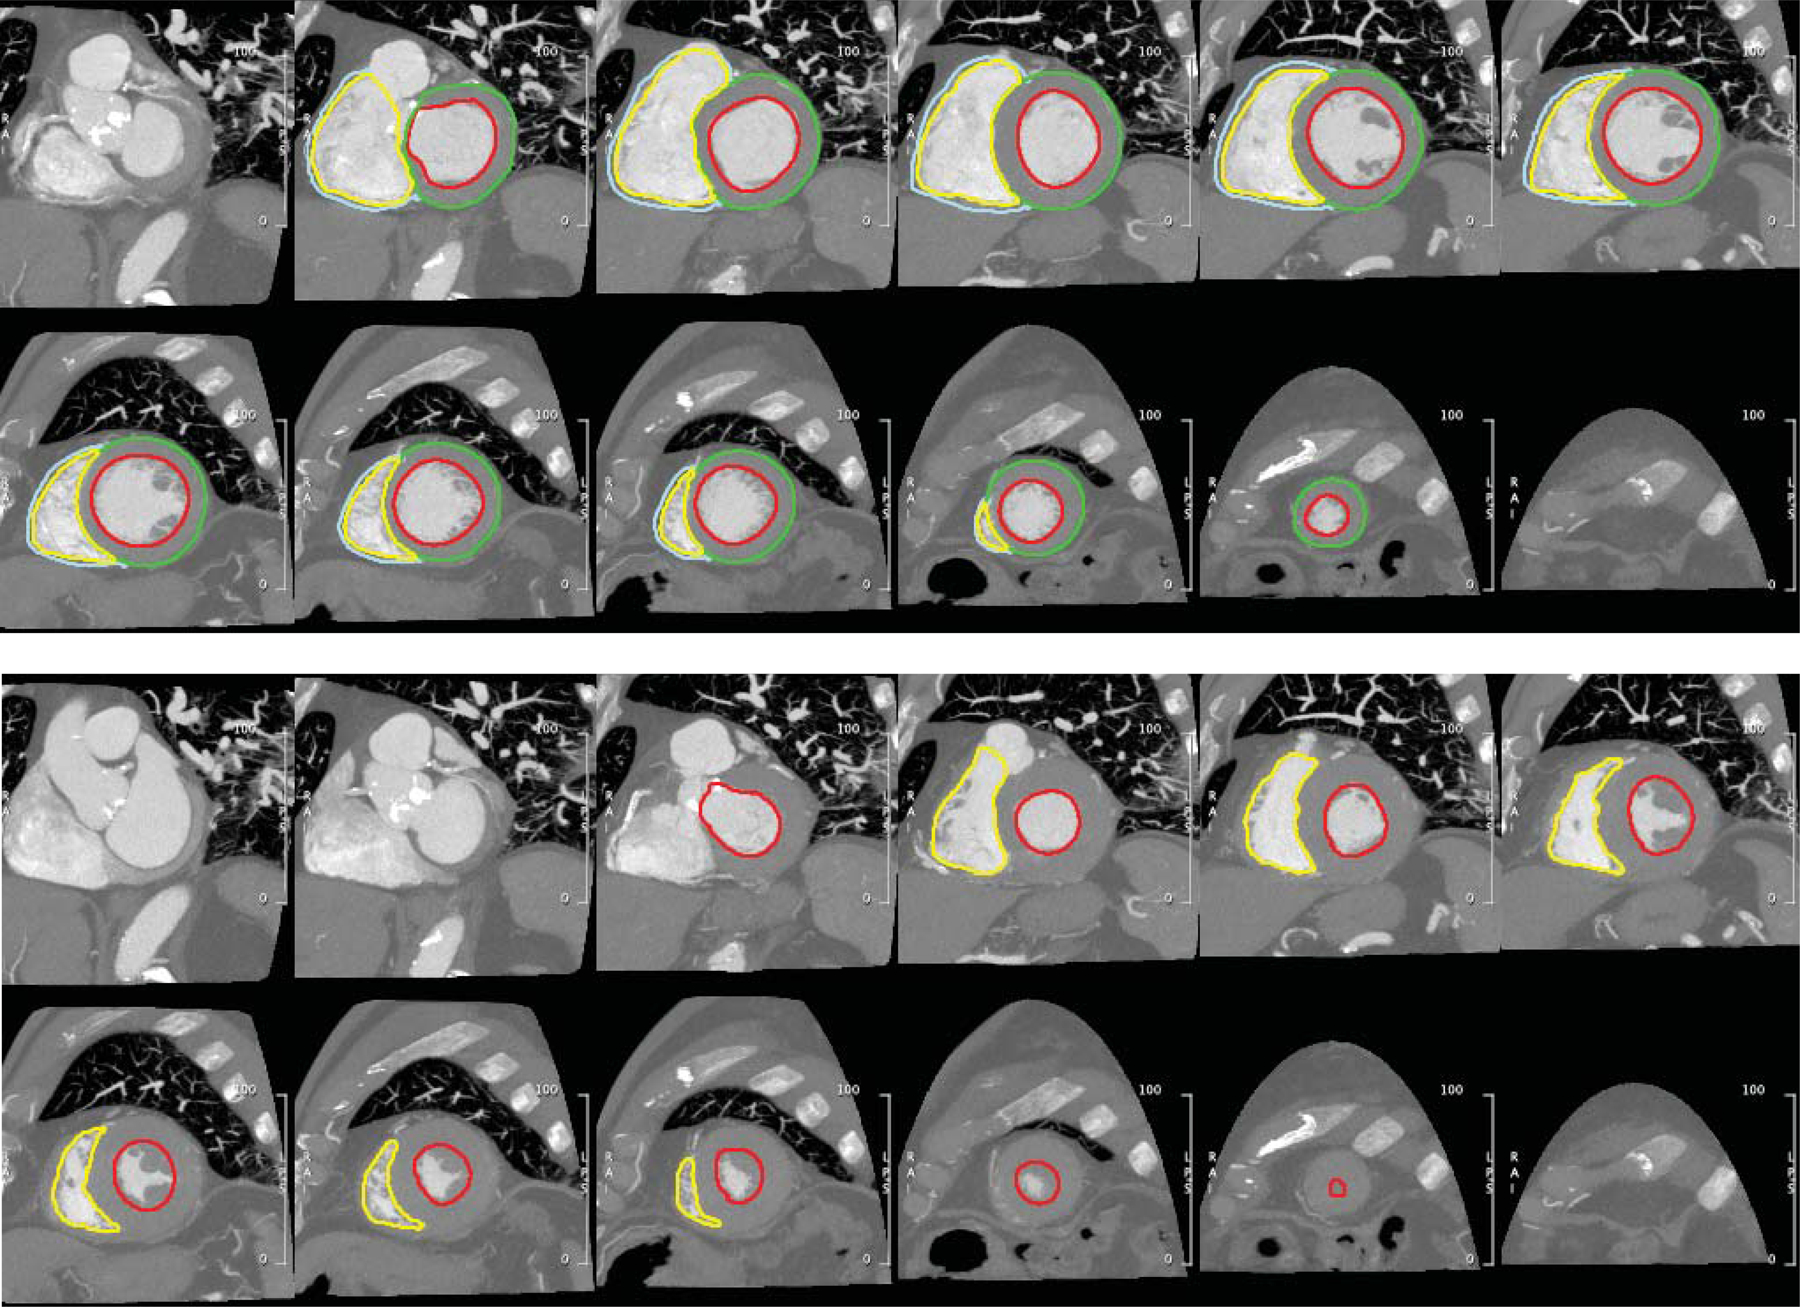
Endocardial LV (red) and RV (yellow) contours were annotated on short-axis reconstructions of the end-diastolic (top) and end-systolic (bottom) phases for volumetric evaluation of chamber size and function. Epicardial contours of the LV (green) and RV (cyan) in the end-diastolic phase enabled assessment of myocardial mass.