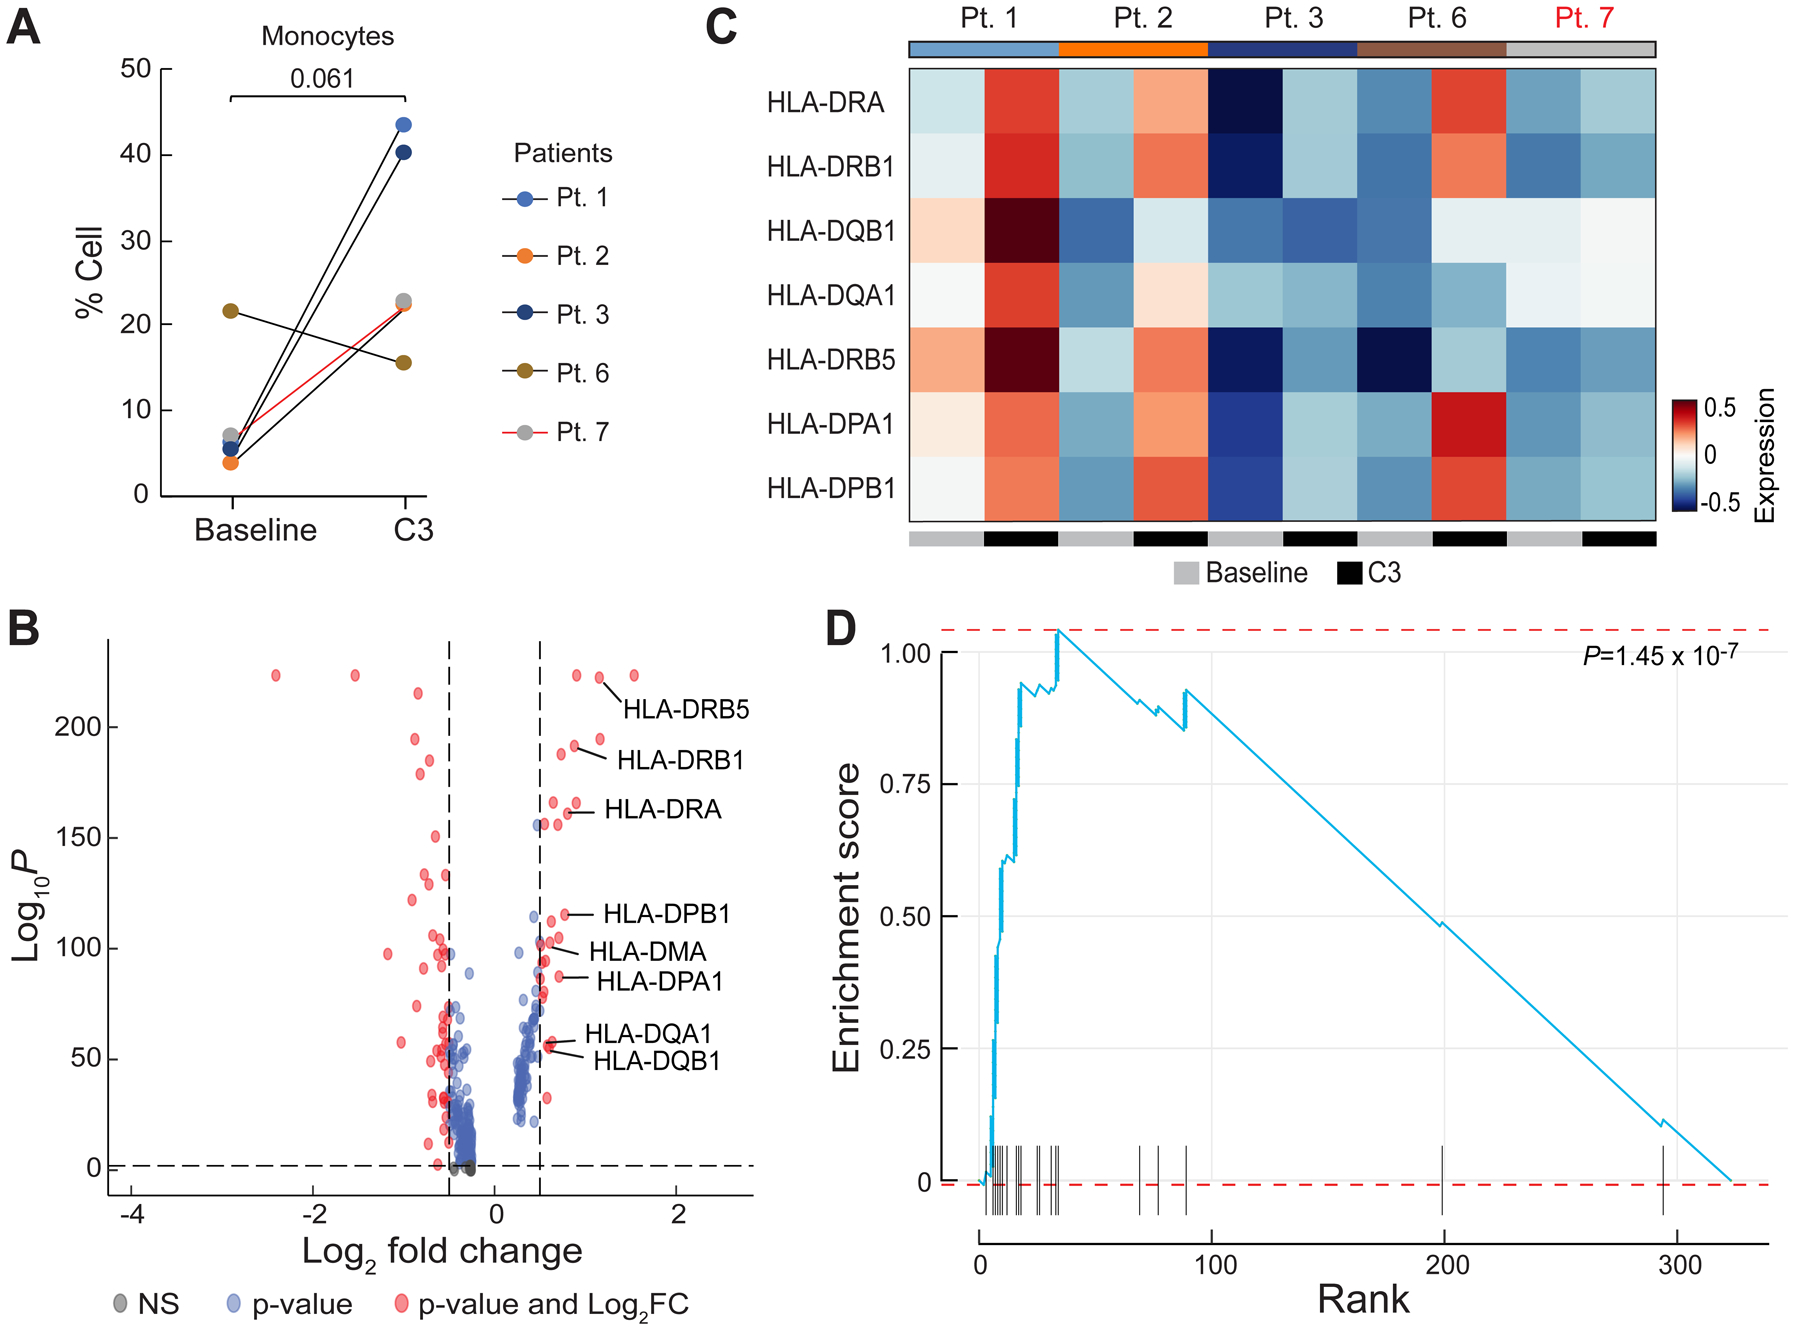
Figure 5.

Differential gene expression analysis in monocytes after chemotherapy. A, Quantification of the percentage of monocytes pre-chemotherapy (Baseline) and after the third cycle of chemotherapy (C3). P-value was calculated using a two-sided one-sample t-test. Black lines represent CA125 complete responders and the red line represents the CA125 incomplete responder. B, Differentially expressed genes in 5 patients (Pts. 1, 2, 3, 6, and 7) in the combined dataset between Baseline and C3. Red dots represent genes with statistically significant change in gene expression (false discovery rate-corrected P-value < 0.01 and log2 fold change > 0.5). Positive values indicate upregulated genes after C3. C, Heatmap of the average expression of the 8 HLA genes labeled in (B) at baseline and C3. Patients labeled in black were CA125 complete responders and the patient labeled in red was a CA125 incomplete responder. D, Enrichment score of the identified upregulated genes at C3 overlapped with the Gene Ontology Biological Process (GOBP) antigen processing and presentation pathway gene set.
