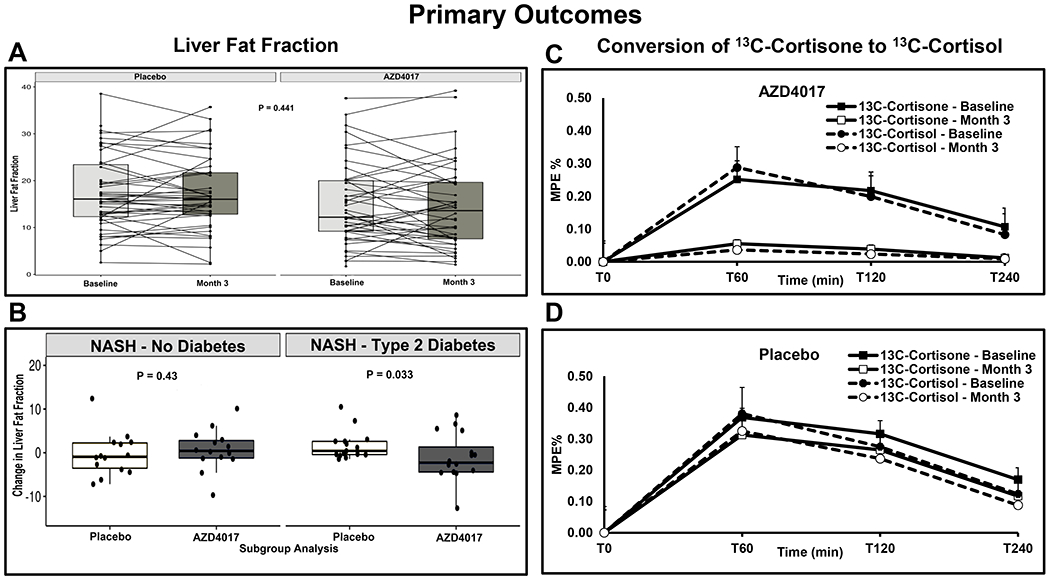
FIGURE 2.

Change from baseline in liver fat fraction (LFF) and the conversion of 13C cortisone to 13C cortisol up to week 12. A, Overall mean (standard deviation [SD]) percentage changes in LFF. B, Mean (SD) percentage changes in LFF in patients with nonalcoholic steatohepatitis (NASH) and in those with NASH and type 2 diabetes. C, Overall mean (SD) percentage change in 13C cortisone to 13C cortisol in patients who received AZD4017. D, Overall mean (SD) percentage change in 13C cortisone to 13C cortisol in patients who received placebo. P values presented are Wilcoxon rank-sum tests. MPE, mole percent excess
