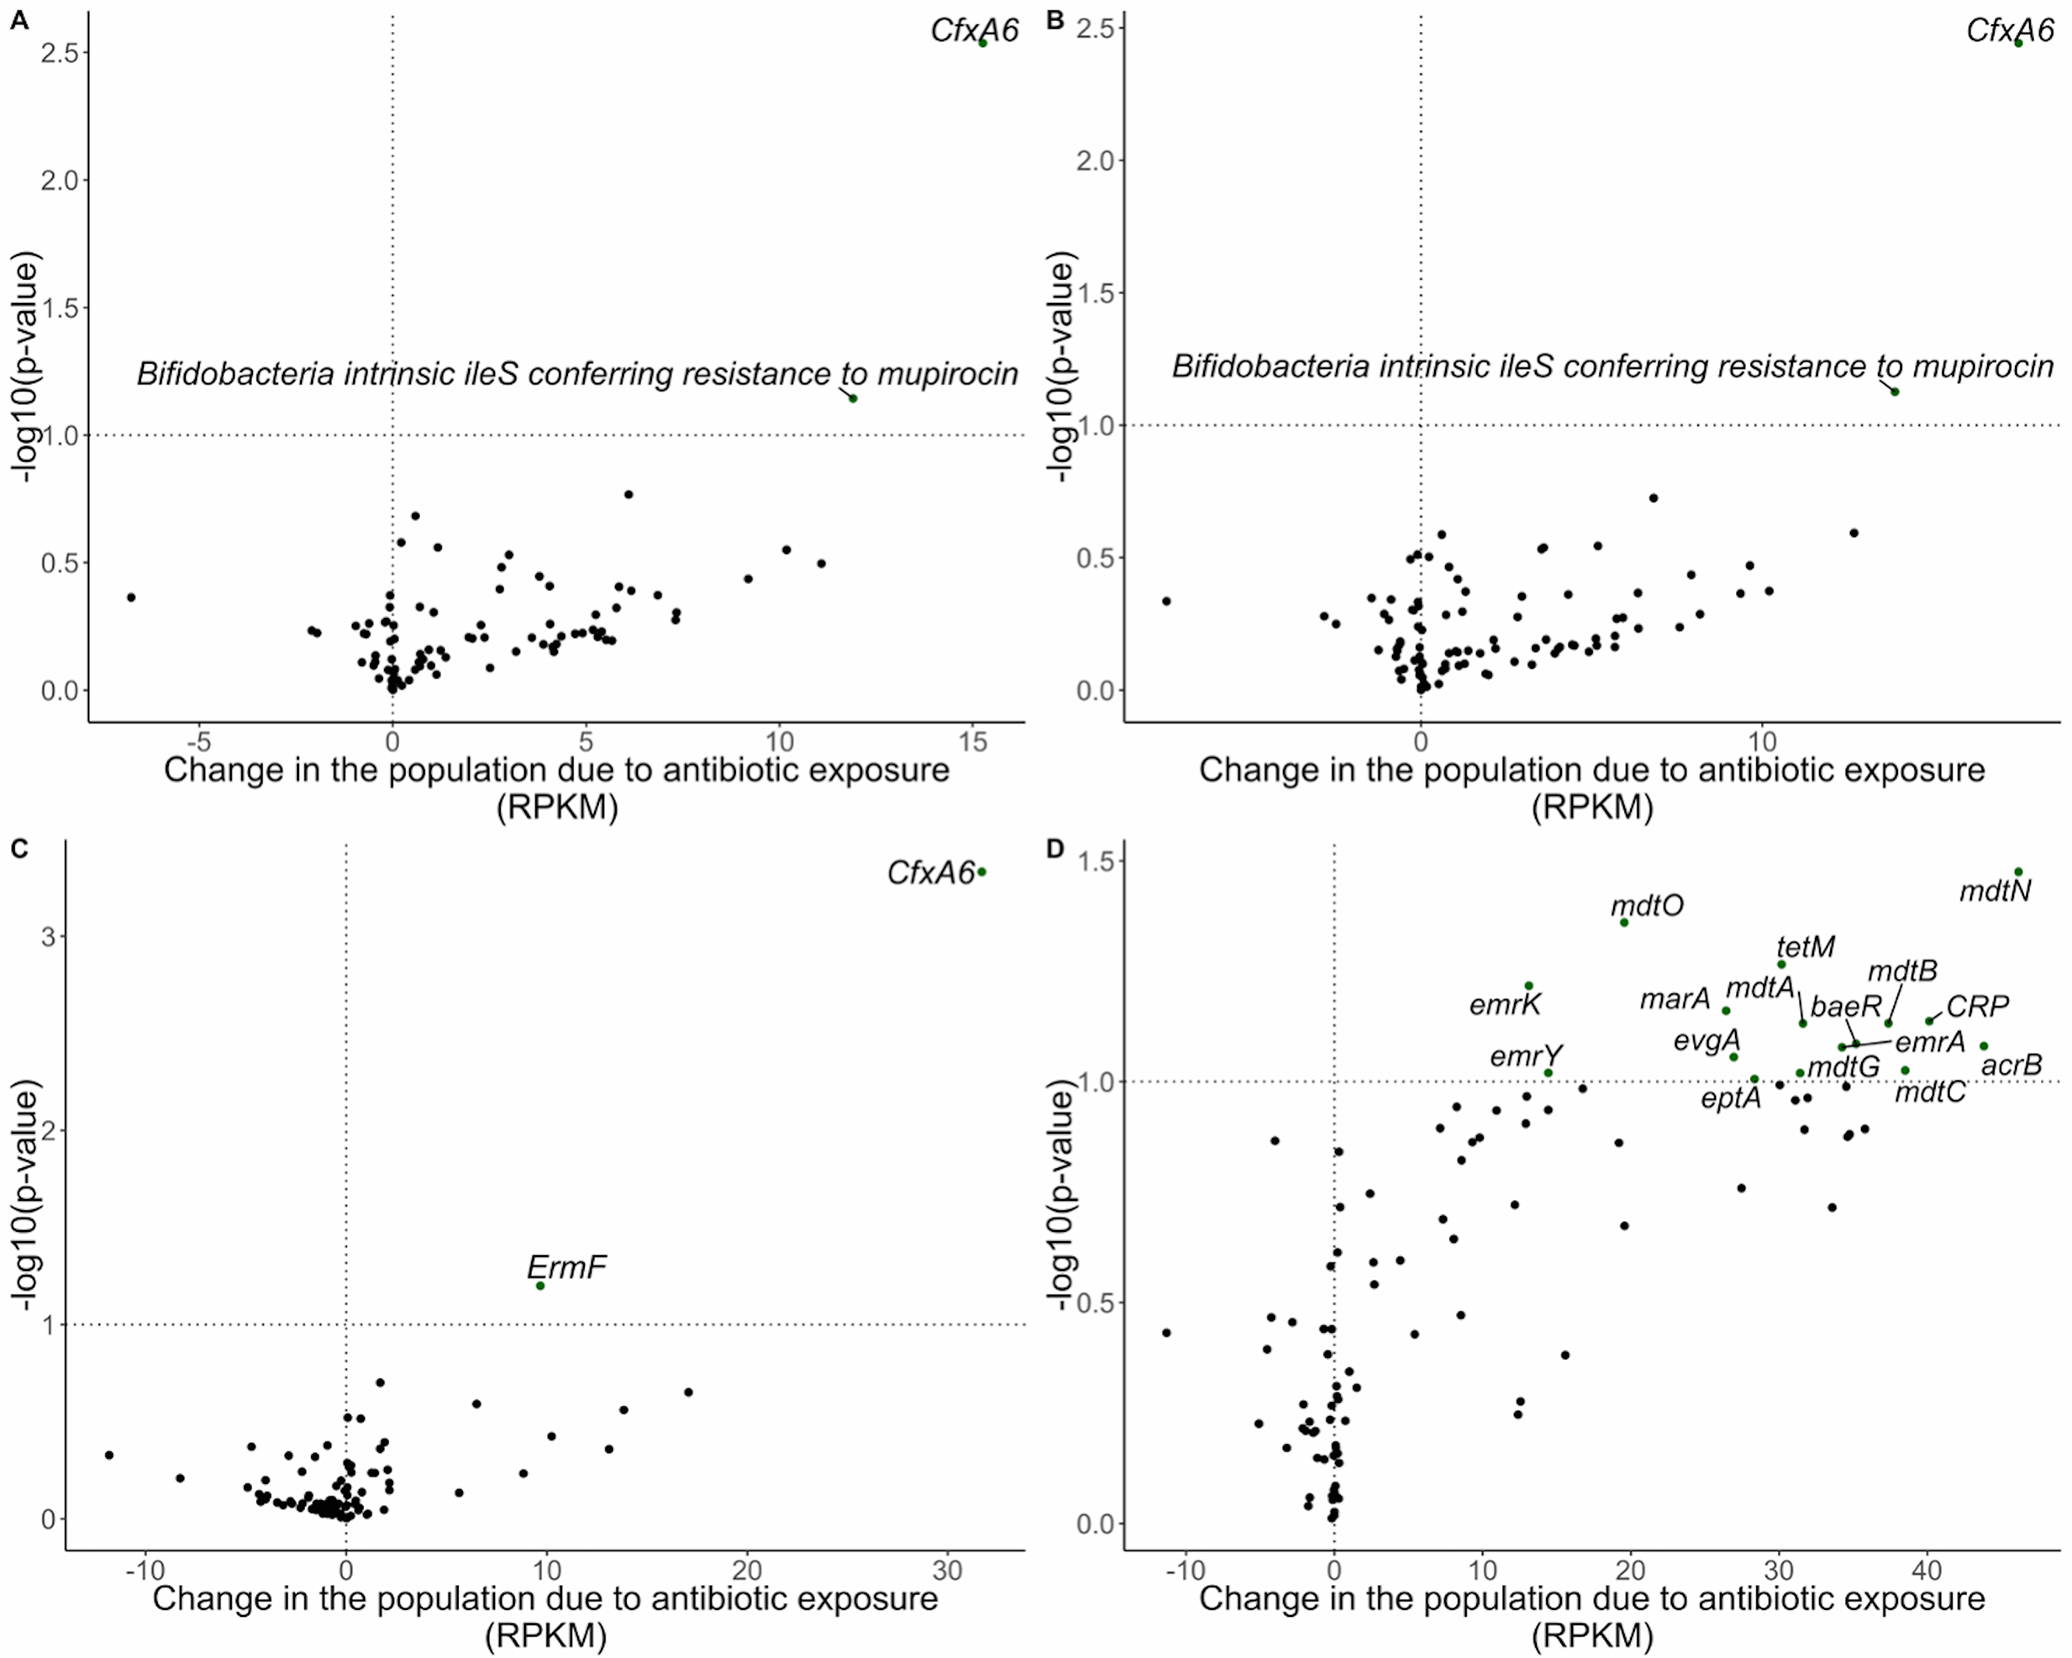
Figure 3:

Volcano plots demonstrating abundance of antibiotic resistance gene changes in the population due to any antibiotic exposure in RPKM. Line marks p-value < 0.1. A) Change in the population due to antibiotic exposure in the Antibiotic Exposure Cohort (n = 216). The difference-in-difference model for the relative abundance change between exposed and unexposed infants across the two timepoints was adjusted for sample age, breastfeeding duration, delivery mode, sex, gestational age, antibiotic use immediately following birth, study cohort, and a random effect for each subject. B) Change in the population due to antibiotic exposure in NHBCS infants (n = 183). C) Change in the population due to antibiotic exposure in NHBCS infants that did not attend day care by 1 year (n = 91). D) Change in the population due to antibiotic exposure in NHBCS infants that did attend day care by 1 year (n = 76). B was adjusted for the same variables as A with the exception of study cohort and addition of day care attendance by 1 year. C and D models were adjusted for the same variables as B except for day care attendance by one year. Only antibiotic resistance genes with a baseline prevalence greater than 20% within each population are included in the plot.
RPKM = reads per kilobase of reference sequence per million samples reads
