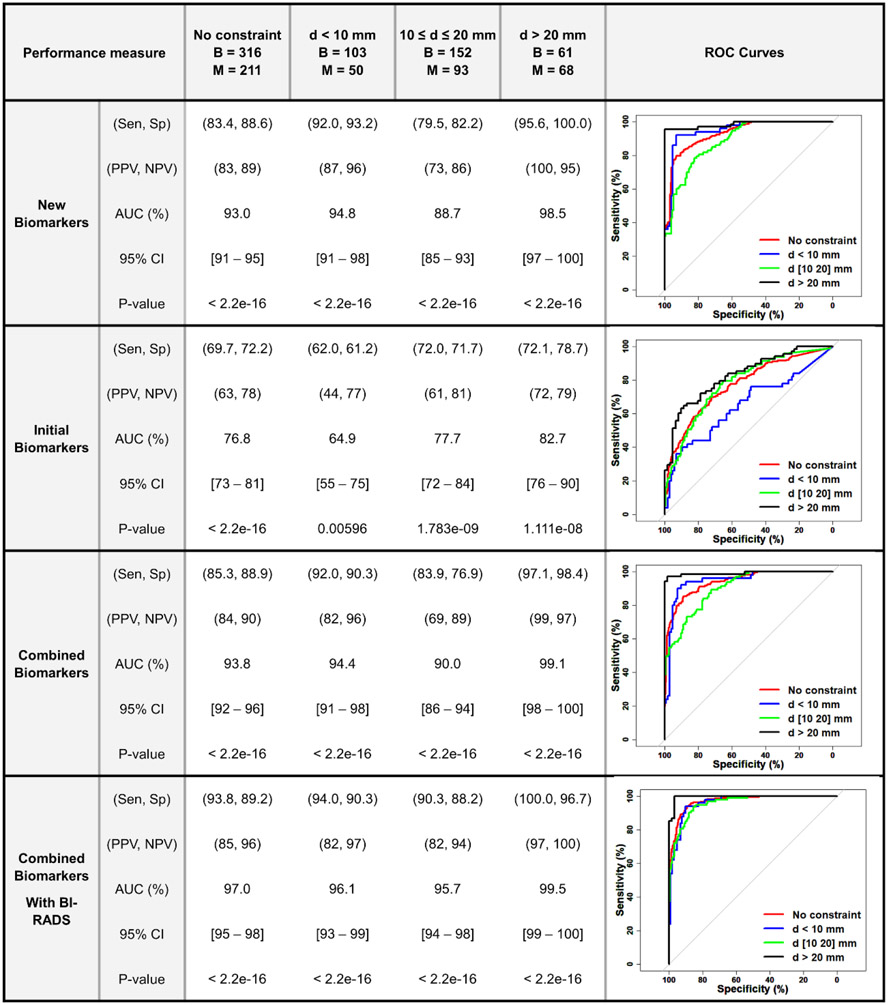
Figure 5.
Summary of logistic regression multivariable analysis and ROC curves for differentiating between benign and malignant in different size groups using new/ initial HDMI biomarkers and combined new/ initial ± BI-RADS. (B (Benign), M (Malignant), Sen (Sensitivity), Sp (Specificity), PPV (Positive Predictive Value), NPV (Negative Predictive Value), AUC (Area under Curve), CI (Confidence Interval), BI-RADS (Breast Imaging Reporting and Data System). The numbers for Sen, Sp, PPV, NPV, AUC and CI are given in percentile.) ROC curves for New HDMI Biomarkers, Initial HDMI Biomarkers, Combined HDMI Biomarkers, Combined Biomarkers With BI-RADS.

