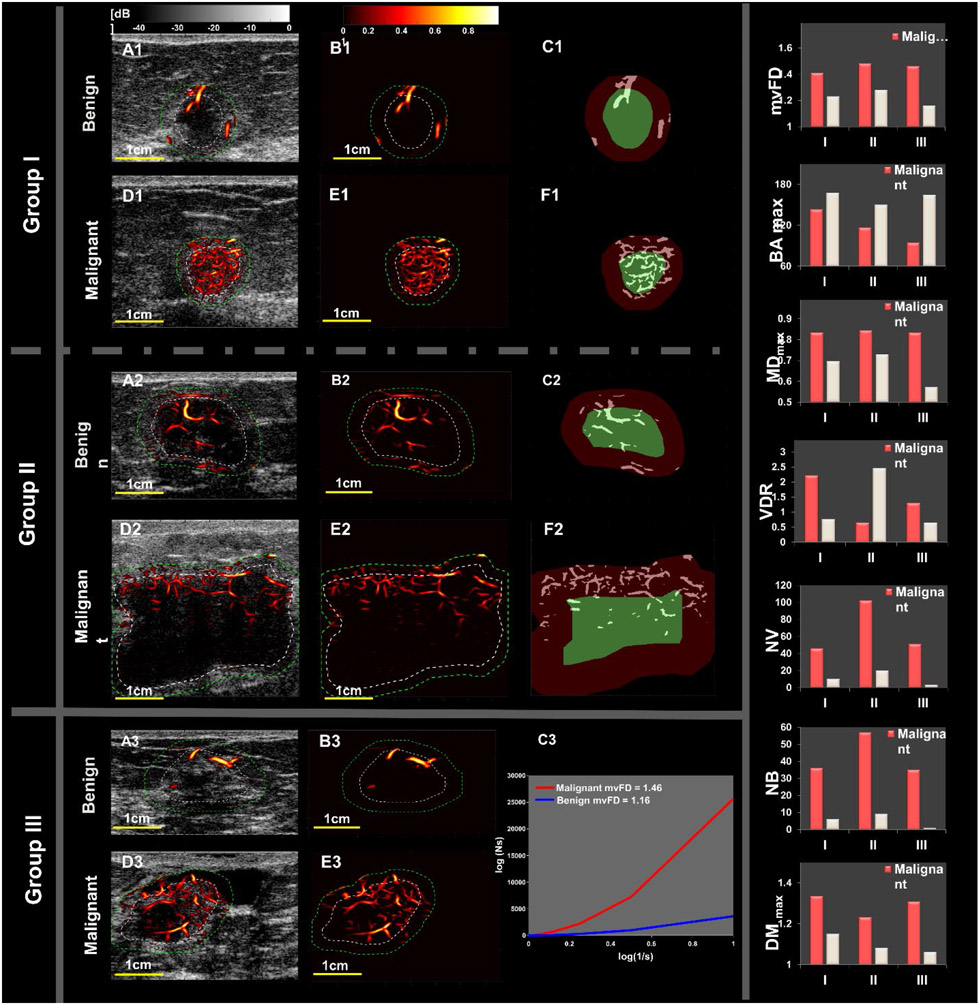
Figure 6.
Representative benign and malignant cases: Groups I and II represent SVP diagrams for microvessel images of breast masses. Group (III) represents mvFD graphs for the microvessel images of a benign and a malignant breast mass.
Group I shows breast masses<10mm (benign, top row and a malignant mass, second row). Panels A1, D1, B1 and E1 are the HDMI images. Panels C1 and F1 show the SVP diagrams, indicating peripherally located vessels in the benign mass and centrally located microvessels in the small malignant mass. Group II shows l breast masses>10mm (fibroadenoma, top of row and invasive poorly differentiated ductal carcinoma, NG Gr. III, at the bottom). Panels A2, D2, B2 and E2 are the HDMI images of group II masses. Panels C2 and F2 are the SVP diagrams showing centrally concentrated vessels in the large benign breast mass and peripherally distributed microvessels in the large malignant mass. Group III shows a benign mass (hyalinized fibroadenoma) and a malignant mass (invasive ductal carcinoma, grade II.). Panels A3, D3, B3 and E3 are the HDMI images. Panel C3 is the mvFD graph indicating the complexity of microvessels in these two masses. This graph shows a remarkable difference in the complexity between the malignant and benign masses. The bar graphs on the right side of Figure 6 show that the value of each of the new HDMI biomarkers (mvFD, BA, MD and VDR (representing SVP)) is remarkably different between the benign and malignant masses in each of the three groups.

