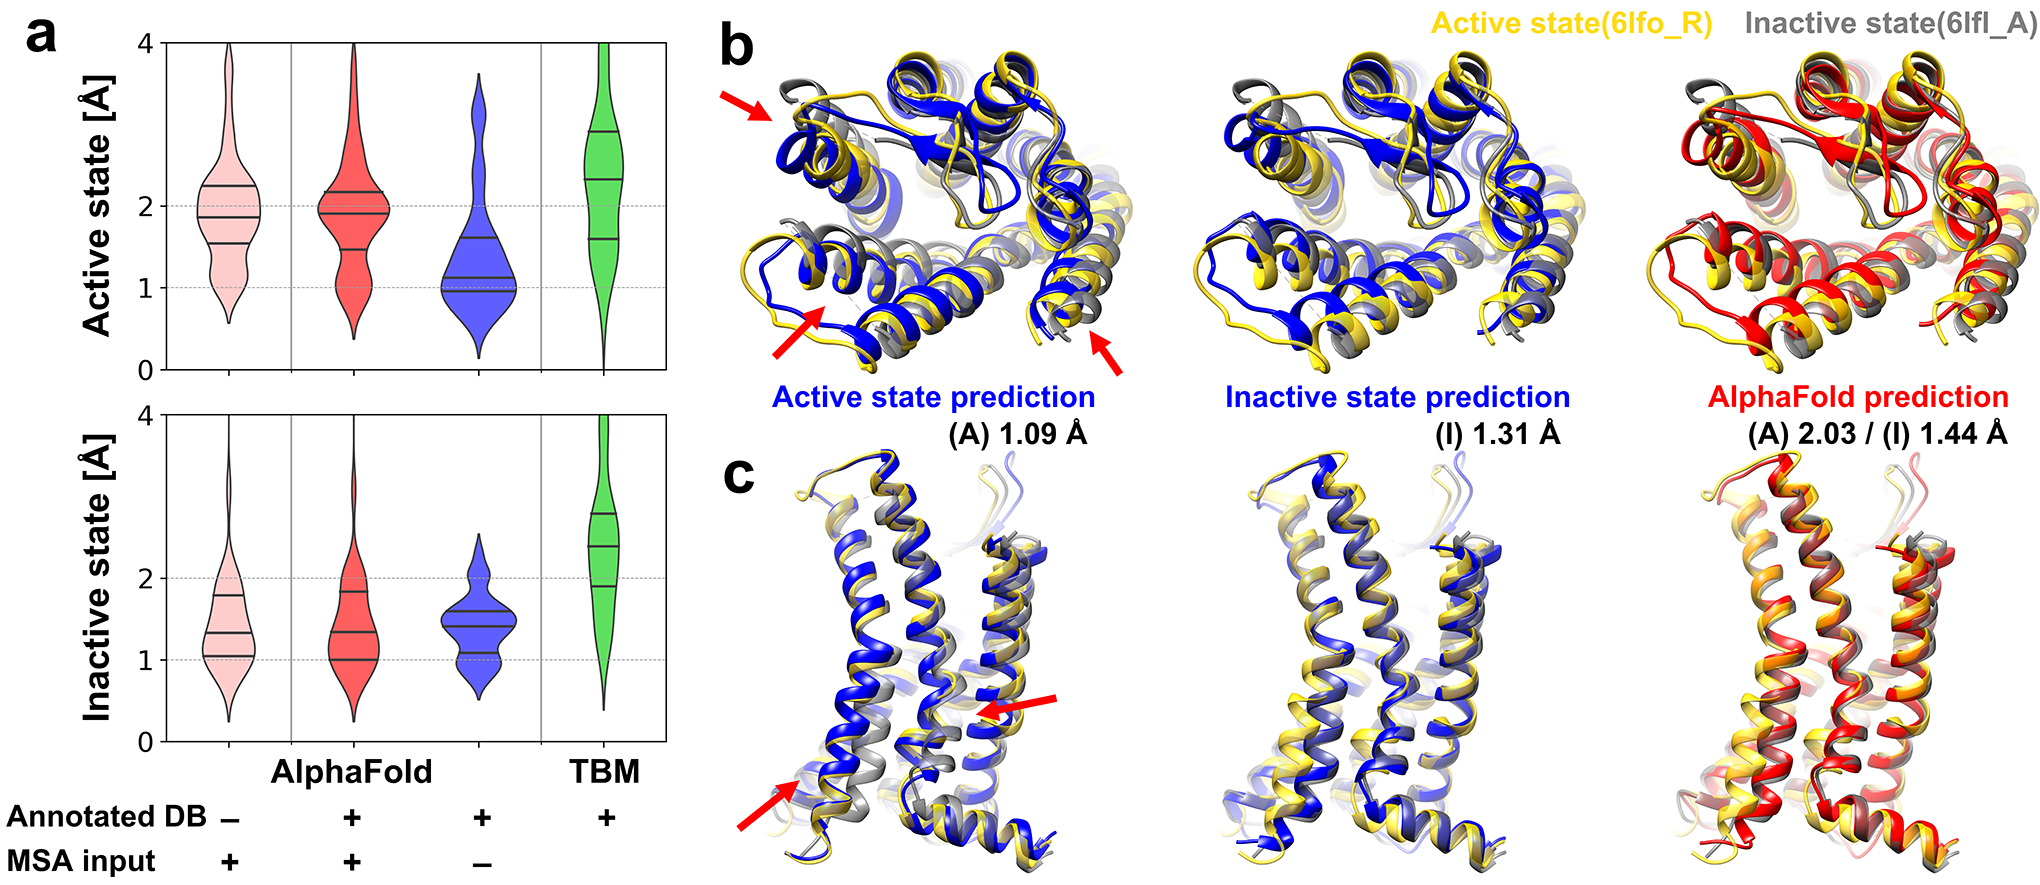
Figure 1.

Modeling of active and inactive states of human G-protein coupled receptor structure (GPCR). (a) Modeling accuracies for human GPCRs that have both active and inactive state experimental structures using various modeling protocols based on AlphaFold and template-based modeling (TBM). Cα-RMSDs are measured with respect to active and inactive forms of transmembrane helices. (TM-RMSD) Distributions of modeling accuracies are shown as violin plots with black lines indicating three quartiles. (b and c) Multi-state modeling of human C-X-C chemokine receptor type 2 (UniProt ID P25025, CXCR2_HUMAN). (b) View from the extracellular region; (c) Side-view. Models predicted as active and inactive forms using customized GPCR databases via AF2 without MSA input features are shown in blue. A predicted model using AF2 with MSA input features and the standard PDB70 database is shown in red. Experimental structures of active state (yellow, PDB ID 6lfo_R) and inactive state (gray, PDB ID 6lfl_A) are compared to the predictions. Selected conformational differences between states are highlighted by red arrows.
