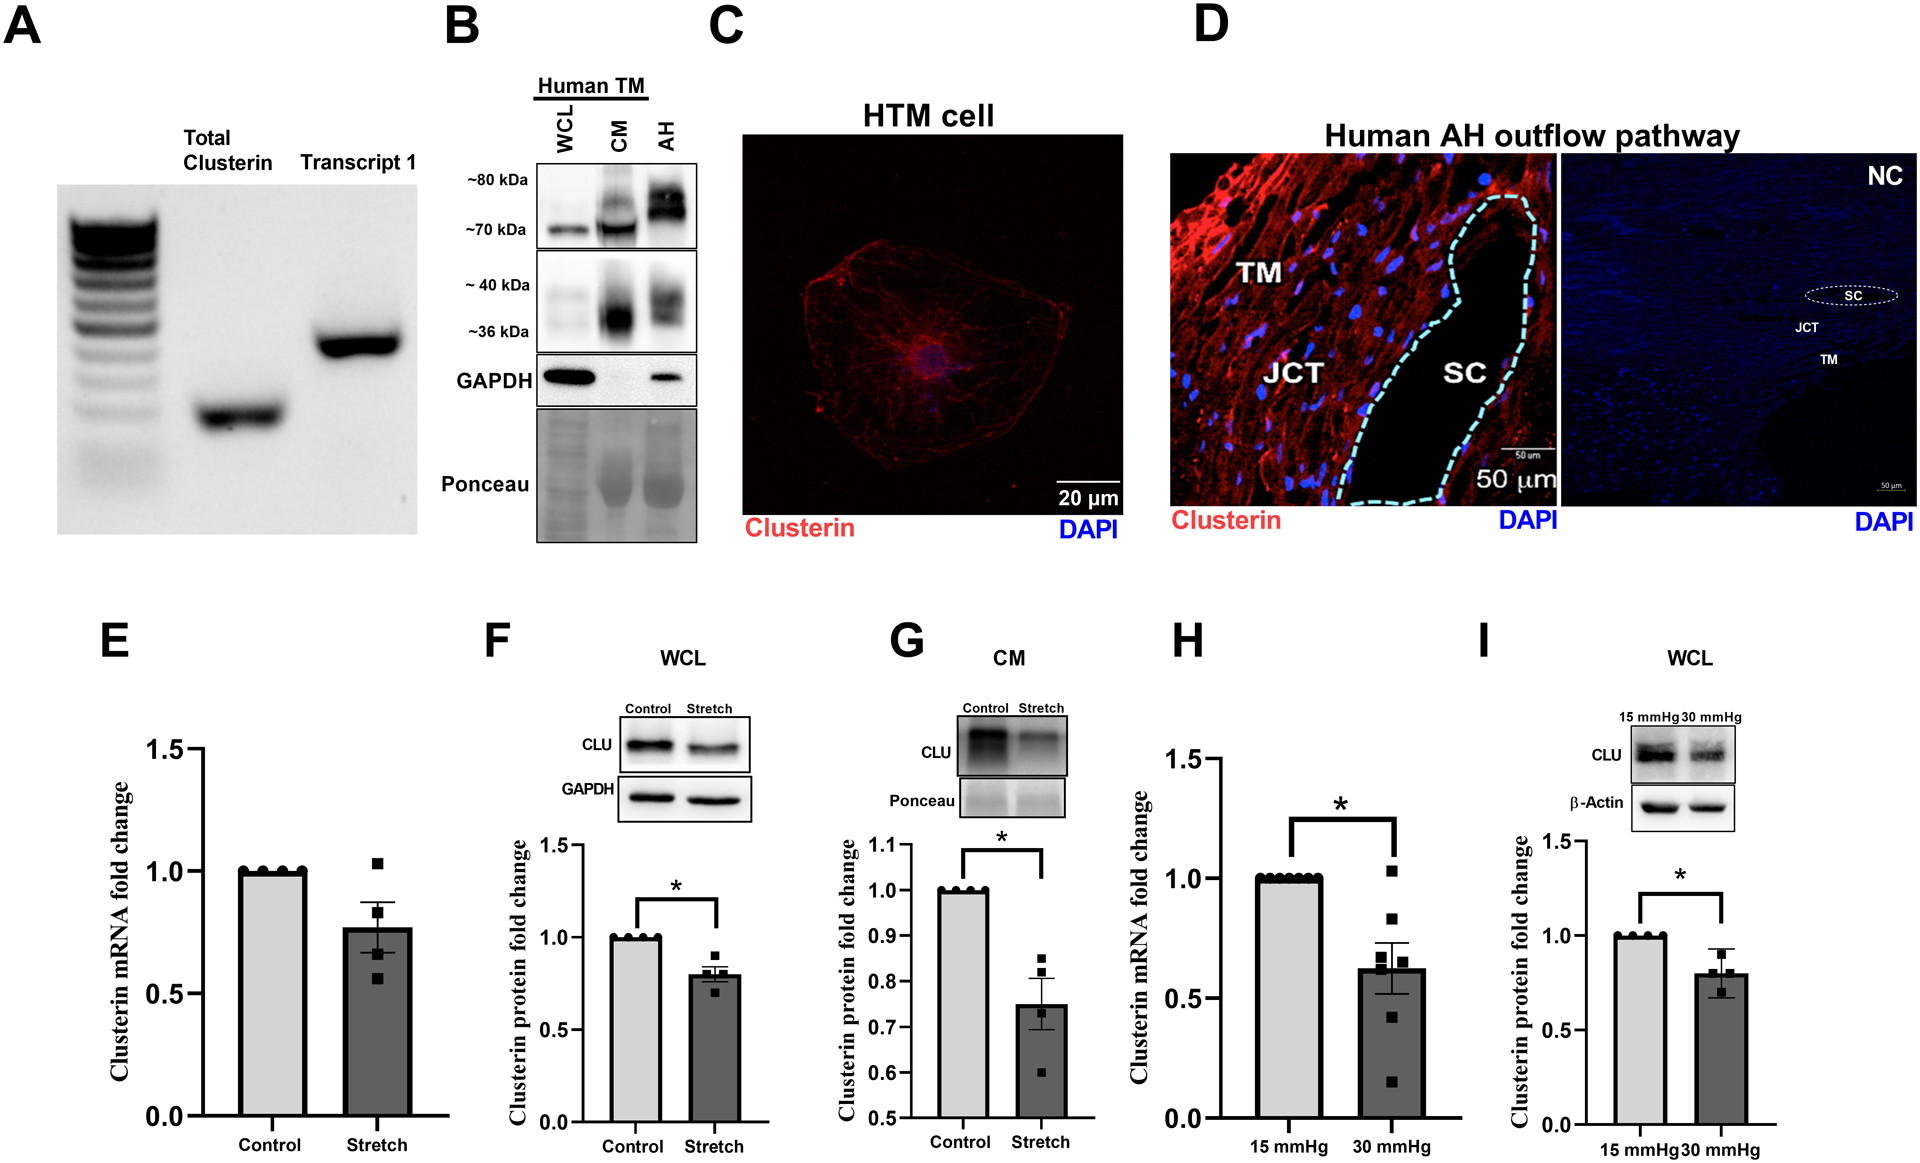
Figure 1: Expression, distribution, and regulation of clusterin in human AH outflow pathway.

A. Expression profile of clusterin isoforms in TM cells by reverse-transcription polymerase chain reaction (RT-PCR) showing transcript 1 that gives rise to secretory clusterin in HTM. B. Protein expression of clusterin in primary HTM cells (donor aged 69y, male, Caucasian)- whole cell lysate (WCL) and conditioned media (CM), and in AH from a human donor eye (donor aged 60y, male, Caucasian). Clusterin is seen at ~70 kDa along with its heterodimers seen at 36–40 kDa in whole cell lysate (WCL). Mature secretory clusterin was seen at ~70–80 kDa in both CM and AH along with 36–40 kDa heterodimers. GAPDH was used as the loading control for cell lysate, and Ponceau S band was used for CM and AH. C. Immunofluorescence (IF) showing the cytosolic distribution of clusterin (red puncta) in primary HTM cell. The nucleus was stained with DAPI in blue. Images were captured in z-stack in a confocal microscope, and stacks were orthogonally projected. Scale bar 20 microns. D. Tissue distribution of clusterin in the AH outflow pathway of a normal human eye specimen by IF. The representative image shows the clusterin distribution (red) in the TM-JCT region and in the inner wall of SC. DAPI was stained in blue. The negative control in the presence of secondary antibody alone did not show any significant staining (right panel). Images were captured in z-stack in a confocal microscope, and stacks were orthogonally projected. Scale bar 50 microns. E-I. Regulation of clusterin mRNA and protein expression by mechanical stress. E. mRNA expression showed no significant change. F-G. protein levels in WCL and CM was significantly reduced in HTM cells subjected to cyclic mechanical stretch compared to non-stretched control. H. mRNA and I. protein expression in WCL significantly reduced in TM derived from enucleated porcine anterior segments perfused under the elevated pressure of 30 mmHg for 5 h compared to 15 mmHg. The results were based on semi-quantitative immunoblotting with subsequent densitometric analysis. GAPDH and HMBS for HTM and PTM, respectively, were used as internal controls for qPCR analysis. GAPDH, β-actin, or ponceau was used as a loading control for immunoblotting analysis. Values represent the mean ± SEM, where n=4–7 (biological replicates). * p≤0.05 was considered significant.
