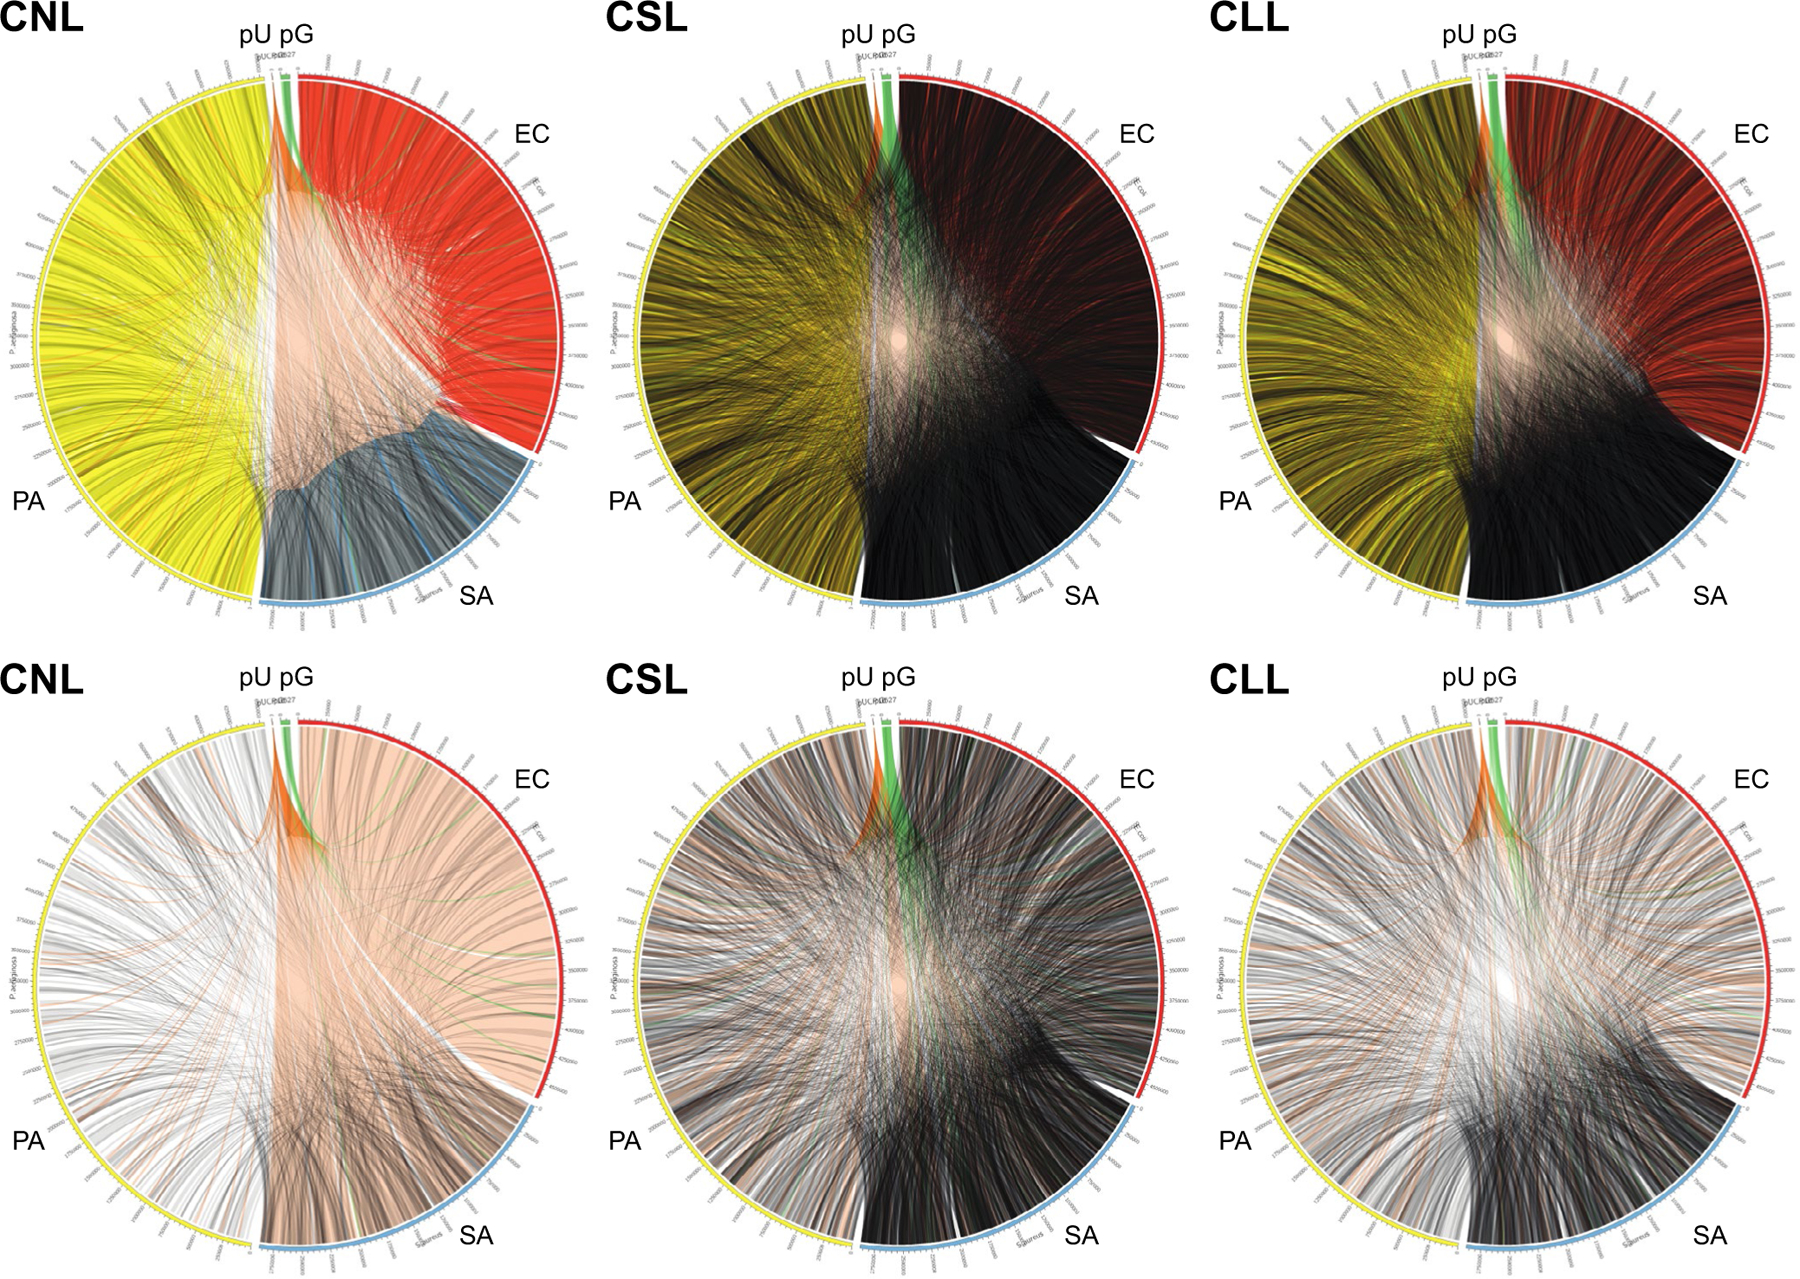
FIGURE 5.

Hi-C link positions within and between cells and plasmids for cell mixtures (3-species artificial polymicrobial “communities”), drawn in Circos. Upper row shows plots for all links (not normalized); lower row shows only interspecies or chromosome-to-plasmid links, normalized to the same number of links between samples. CLL, cells long lysis; CNL, cells no lysis; CSL, cells short lysis; EC, Escherichia coli; PA, Pseudomonas aeruginosa; pU, pUCP18 plasmid; pG, pG527 plasmid; SA, Staphylococcus aureus
