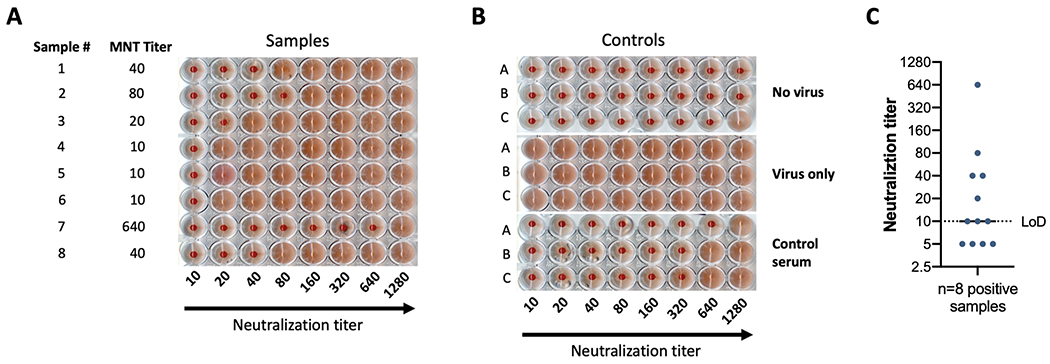
Figure 4.

(A) depicts the results of a microneutralization assay against B/Brisbane/60/2008 using samples with variable titers. Sample number and neutralization titer are shown in the two left columns. Serum samples were diluted starting 1:10, followed by 2-fold dilutions from left to right. Lack of agglutination forms a cellular pellet at the bottom of the plate, while agglutination forms a homogenous cloudy reddish cell suspension. (B) depicts the controls used for the experiment performed in (A). A representation of plotting and neutralization titer visualization is shown in (C). The limit of detection (LoD) of the assay is indicated by the dotted line. Four negative samples are displayed below the LoD. Eight positive samples equal to or too above the limit of detection are shown.
