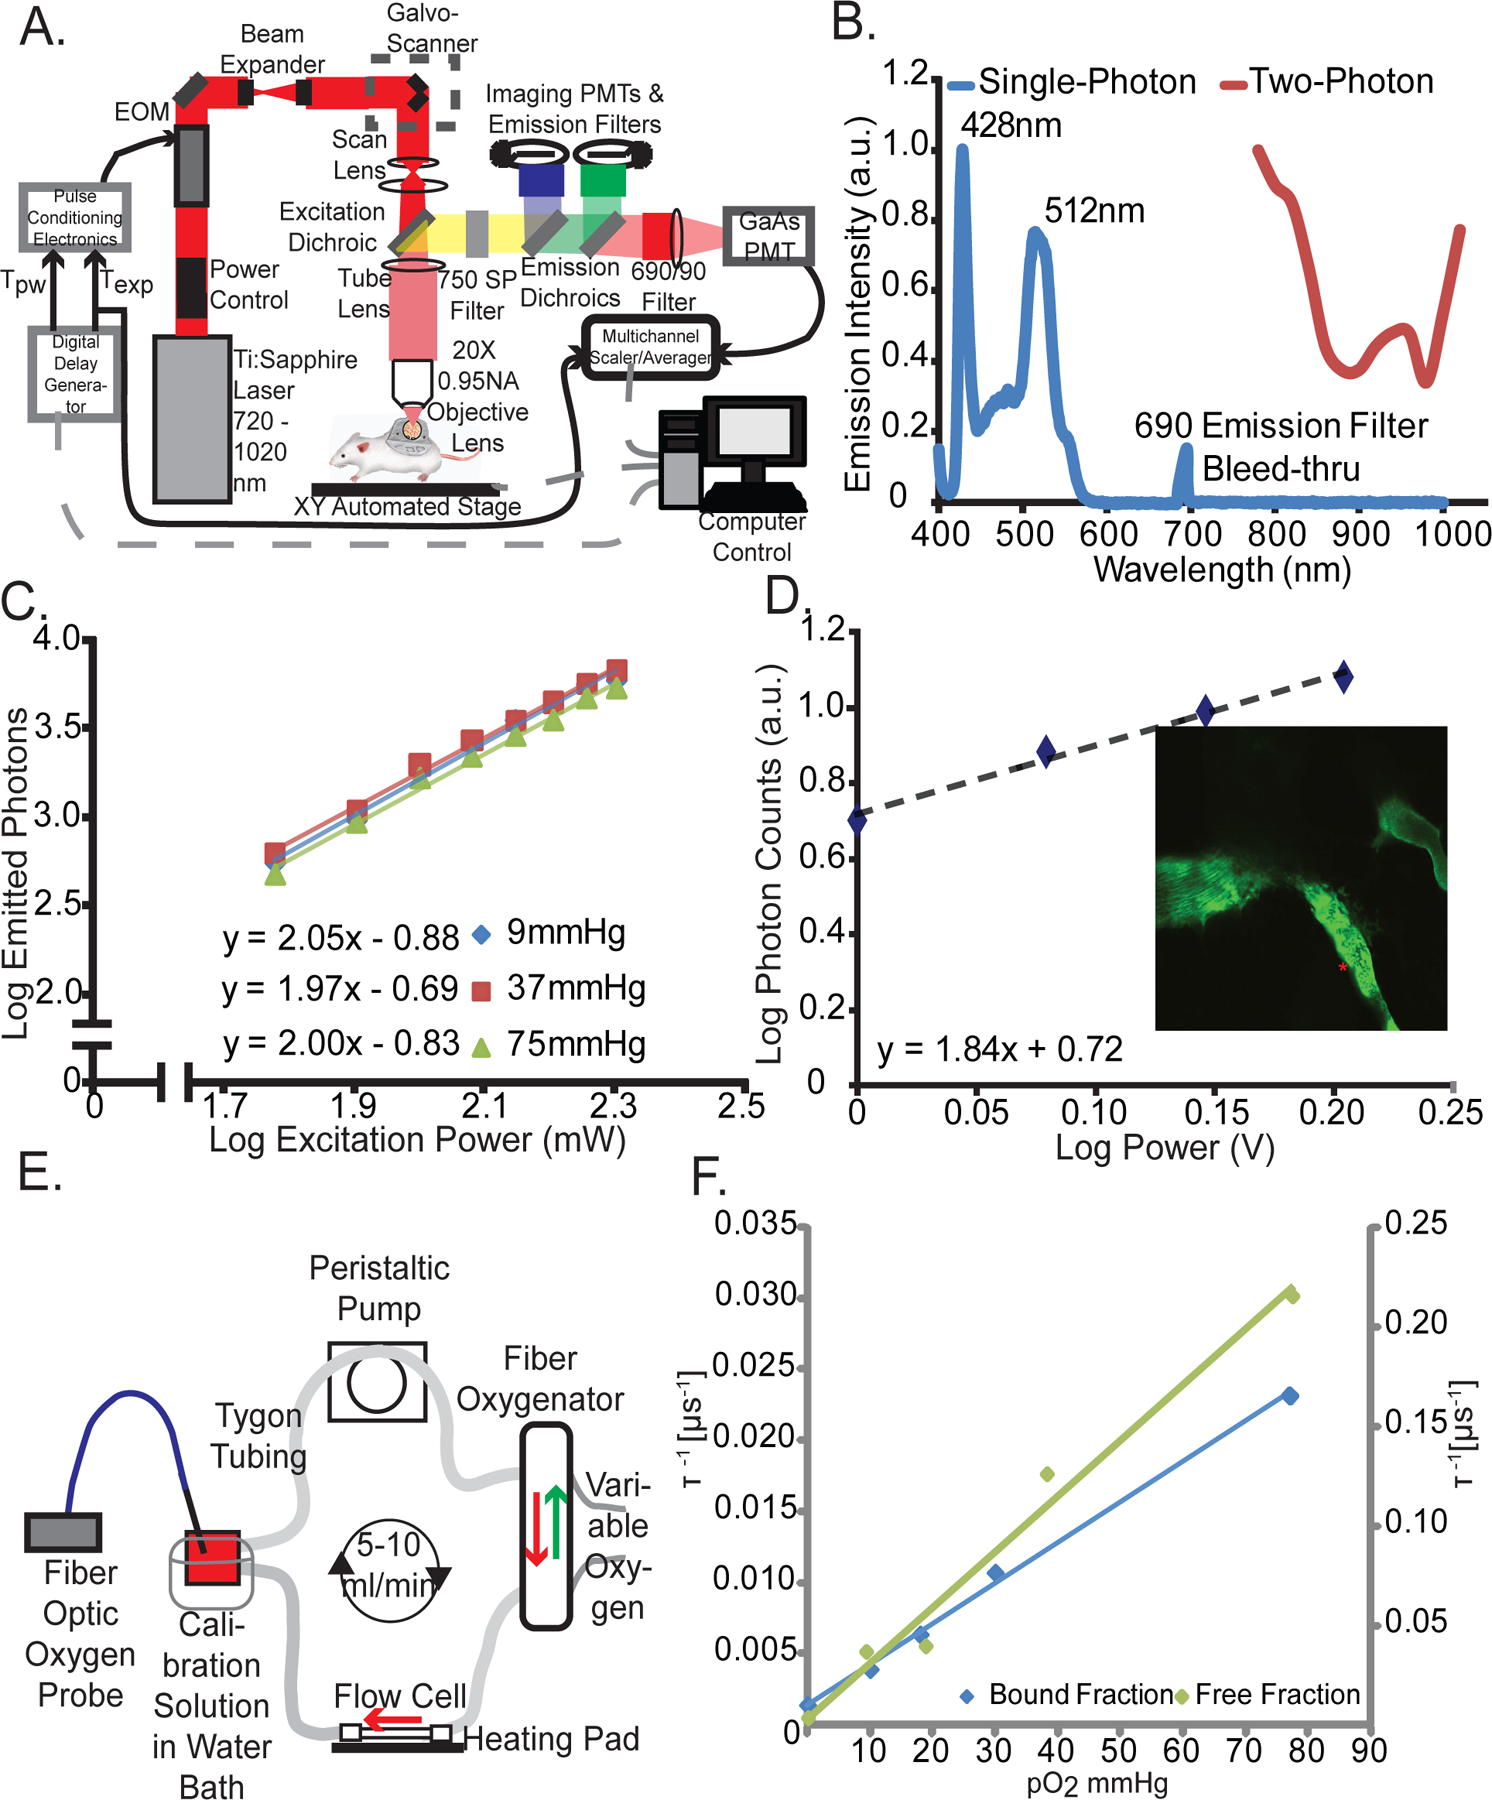
Figure 1 – Multiphoton Phosphorescence Quenching Microscopy (MP-PQM).

(A) Schematic of the experimental setup. EOM, electro-optic multiplier; PMTs, photomultiplier tubes; GaAs, Gallium arsenide; Tpw, temporal duration of the excitation pulse width; Texp, duration of the experimental triggering time. Arrows indicate direction of communication. Dashed grey lines indicate two-way communication. (B) Single- and two-photon action cross-sections for Pd-porphyrin soluble oxygen sensor. The single-photon excitation spectrum (blue line) does not show absorption or emission in the wavelength range of two-photon (red line). The lone peak at 690 nm is due to excitation light at the same wavelength as the emission band-pass filter in the spectrophotometer. (C) Two-photon excitation at 1,020 nm of Pd-porphyrin phosphorescent oxygen sensor relating the emitted photons to the excitation power on a log-log scale. The experiment was repeated at oxygen tensions of 9 mmHg, 37 mmHg, and 75 mmHg (blue, red, and green lines, respectively). (D) In vivo two-photon excitation of Pd-porphyrin oxygen sensor. A series of time domain lifetime measurements performed in tumor vasculature (red asterisk, inset) shows the non-linear excitation of Pd porphyrin sensor. (E) Diagram of the recirculating, sealed calibration system employing a fiber oxygenator indicating the direction of fluid and gas flow. An independent pO2 measurement is made with a calibrated optical fiber ruthenium-based probe. (F) Two-photon calibration of the albumin-bound (blue line) and single-component (green line) fits of the Pd-porphyrin oxygen sensor. The left vertical axis applies to the bound fraction. The right vertical axis applies to the free fraction. The vertical axes are the phosphorescence lifetime in units of μ s−1 and the horizontal axis is oxygen tension in units of mmHg. The Stern-Volmer constant is 3,115 mmHg−1s−1 for the free fraction and 285 mmHg−1s−1 for the bound fraction.
