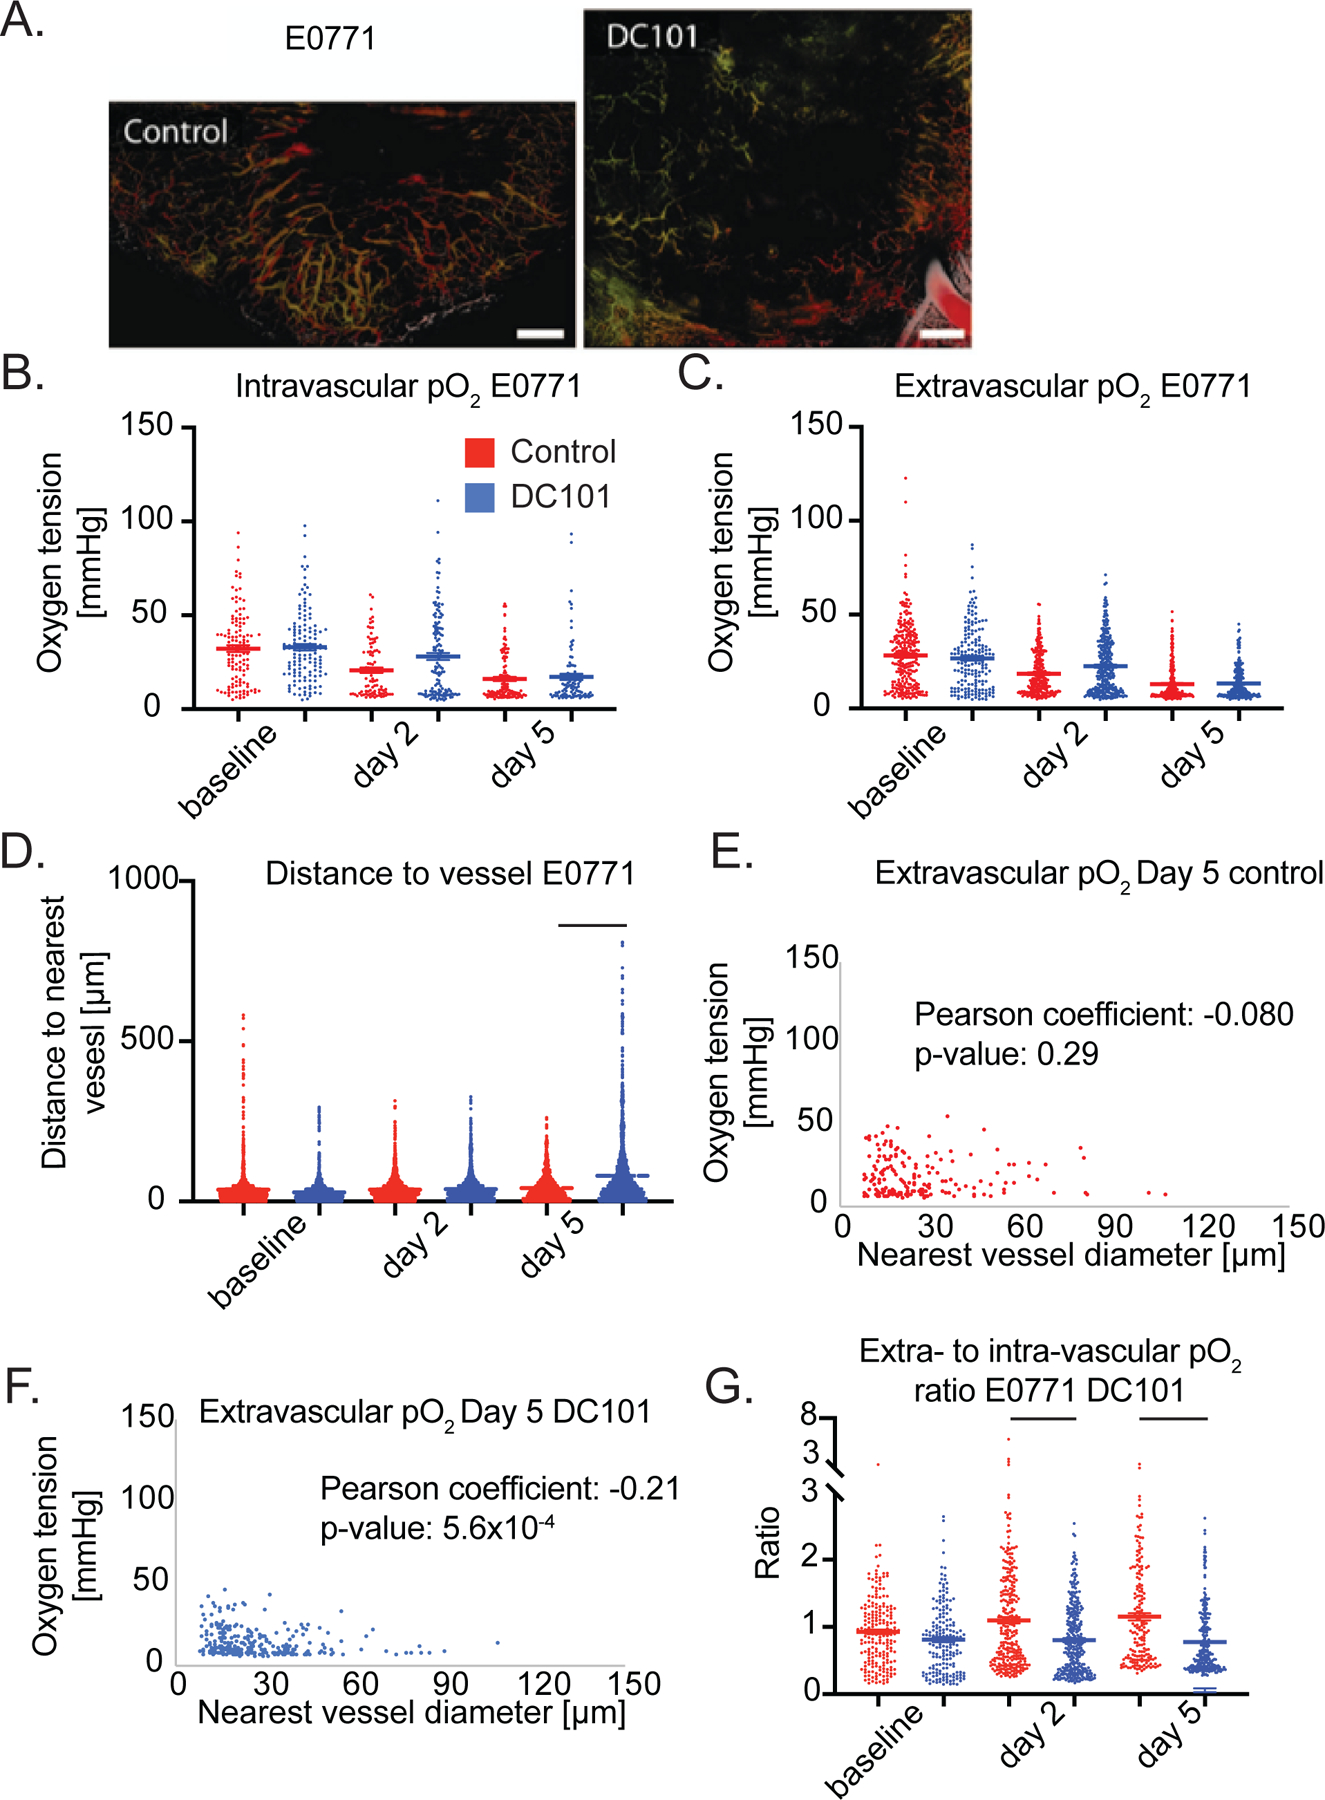
Figure 5 – Anti-VEGFR2 antibody treatment at 40 mg/kg does not affect pO2 but extensively prunes the smallest microvessels by day 5 in E0771.

(A) Representative images of angiographies of murine mammary carcinoma (E0771) tumors treated with control IgG antibody (left panel) or the murine anti-VEGFR2 antibody DC101 (right panel) (both 40 mg/kg i.p. every 3 days) on day 5 after two cycles of treatment. Tumor vasculature is presented as a colorized maximum intensity depth projection (superficial to deep: green, red, white). Scale Bars 500 μm. (B) Measurements of oxygen tension in mmHg in vessels in control IgG and 40 mg/kg DC101 antibody treated mice at baseline, day 2 and day 5. n = 92 – 139 measurements per timepoint per group. N = 5 mice per group. Lines indicate statistically significant differences between multiple comparisons after a Kruskal-Wallis test with Dunn’s correction, with differences only depicted for comparisons between control and treatment groups on the same day. (C) Extravascular (interstitial, i.e., measurements 40 to 60 μm from the nearest vessel) oxygen measurements in the same tumors. n = 179 – 307 measurements per timepoint per group. (D) Distance to the nearest vessel measurements in the same tumors. n = 1,103 – 1961 measurements per timepoint per group. (E) Scatter plot of extravascular oxygen tension versus the diameter of the nearest vessel in control treated E0771 tumors on day 5. Correlation coefficient and p-value are denoted on graph. (F) Scatter plot of extravascular oxygen tension versus the diameter of the nearest vessel in DC101 treated E0771 tumors on day 5. Correlation coefficient and p-value are denoted on graph. (G) Measurements of extravascular oxygen tension in mmHg normalized to the intravascular oxygen tension of blood vessels.
