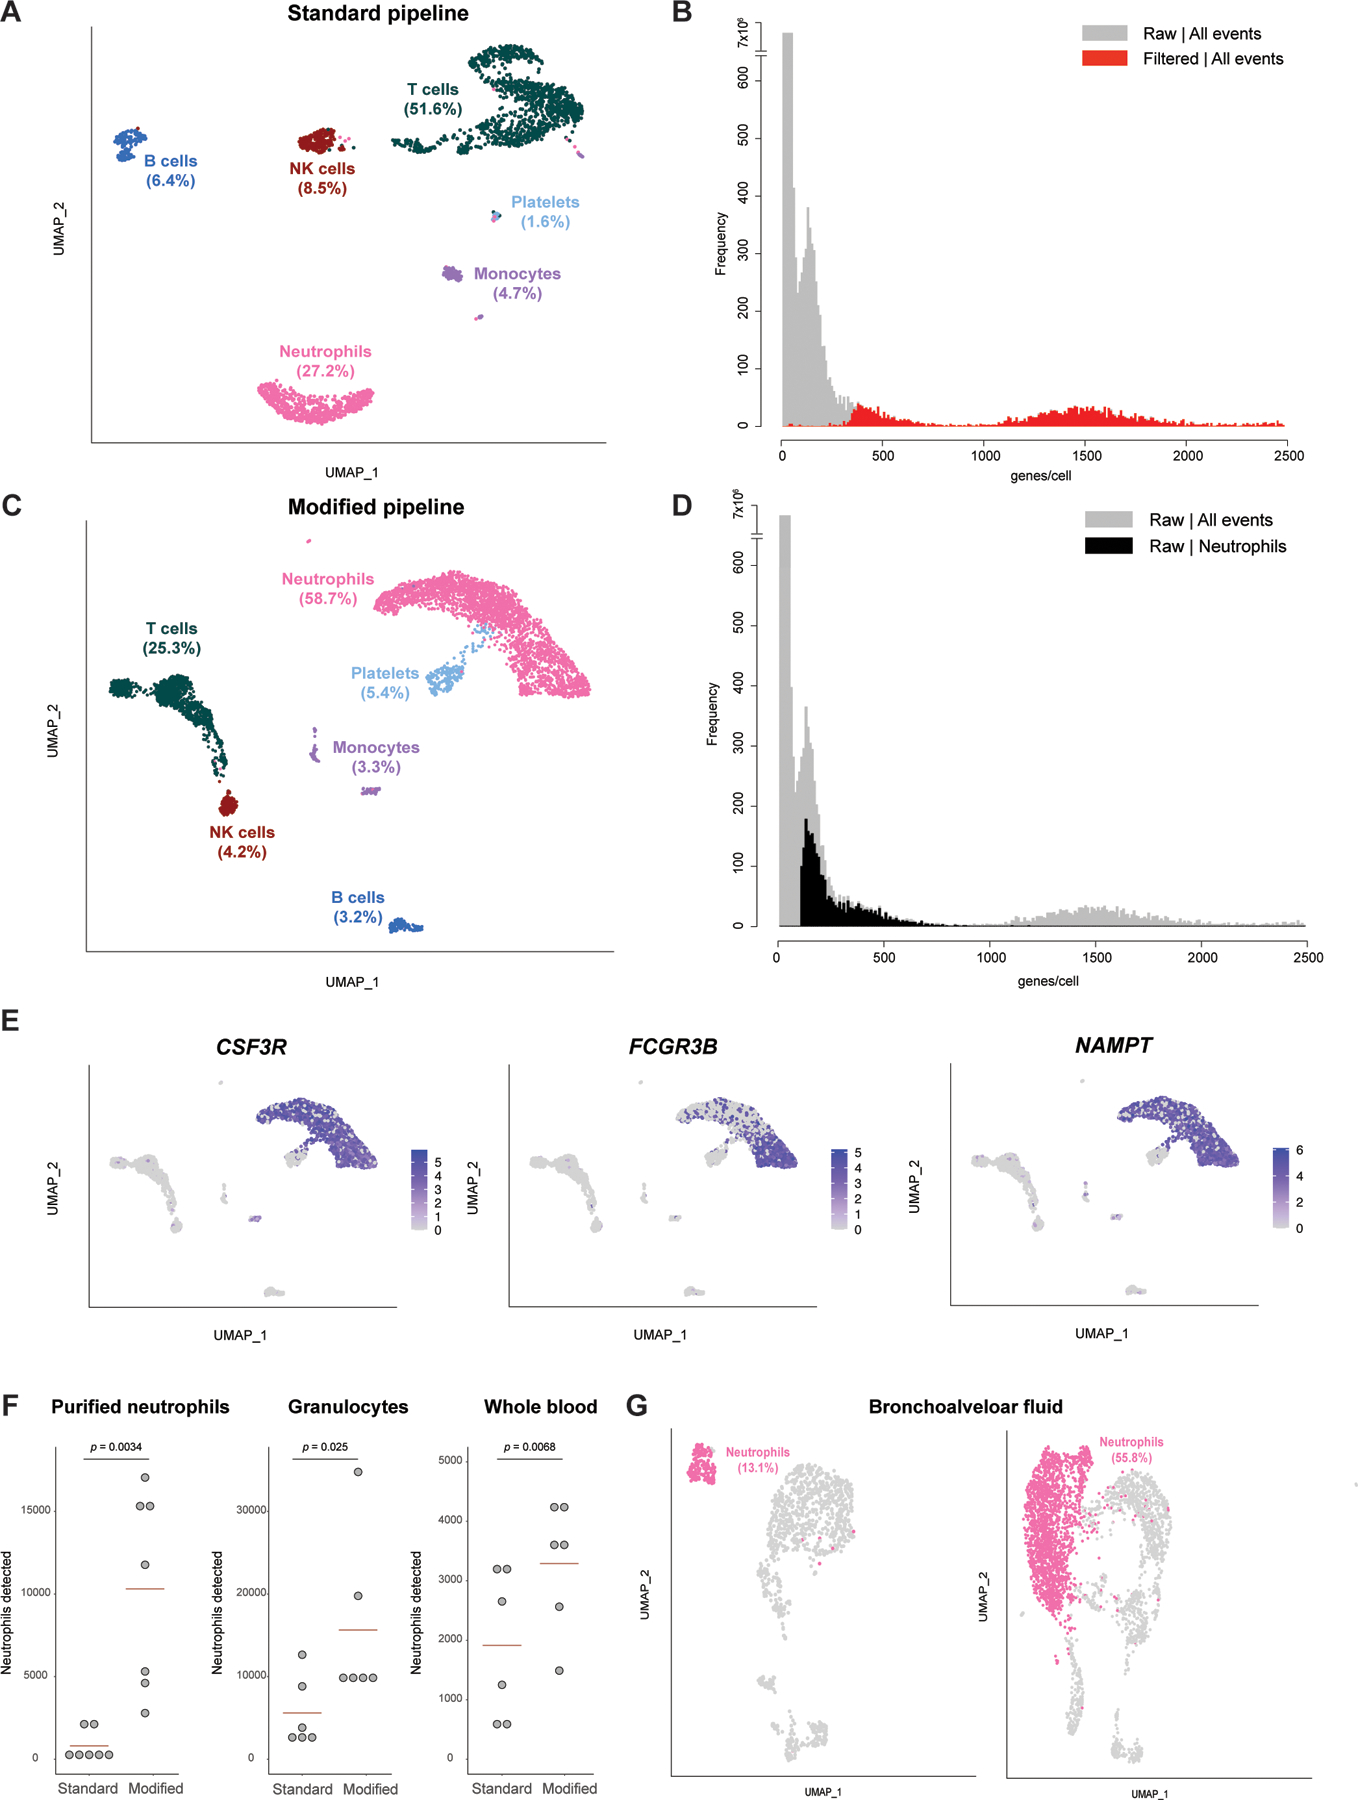
Figure 1. Pipeline for identification of neutrophils in scRNA-seq data.

(A) Distribution of cell types identified in RBC-depleted whole-blood in a scRNA-seq analysis performed with the filtered matrix output from Cell Ranger (standard pipeline). Data from one capture are shown. (B) Frequency distribution of the number of features per barcode (genes per cell) for the dataset shown in (A), comparing data from the filtered (red) versus raw (grey) matrices. (C) Distribution of cell types identified in the dataset shown in (A) when the analysis is performed with the raw matrix output from Cell Ranger (modified pipeline). (D) Frequency distribution of the number of features per barcode (genes per cell) for the dataset shown in (A) and (C), with the distribution for cells identified as neutrophils in the analysis of the raw matrix (modified pipeline) highlighted in black. (E) Feature plot on the UMAP shown in (C) for 3 genes expected to be highly expressed in human neutrophils. (F) Number of neutrophils detected by the standard or modified pipelines in samples from the same subjects processed by three methods. Each dot represents one biological replicate (one unrelated healthy donor). Statistical testing results are from a paired t-test. (G) Proportion of neutrophils identified in a published scRNA-seq dataset of BAL fluid from patients with severe COVID-19 infection, comparing the results of the standard pipeline (left) with those of the modified pipeline (right).
