
Fig. 1. The antigenic landscape of the SARS-CoV-2 receptor binding domain can be divided into seven binding communities.
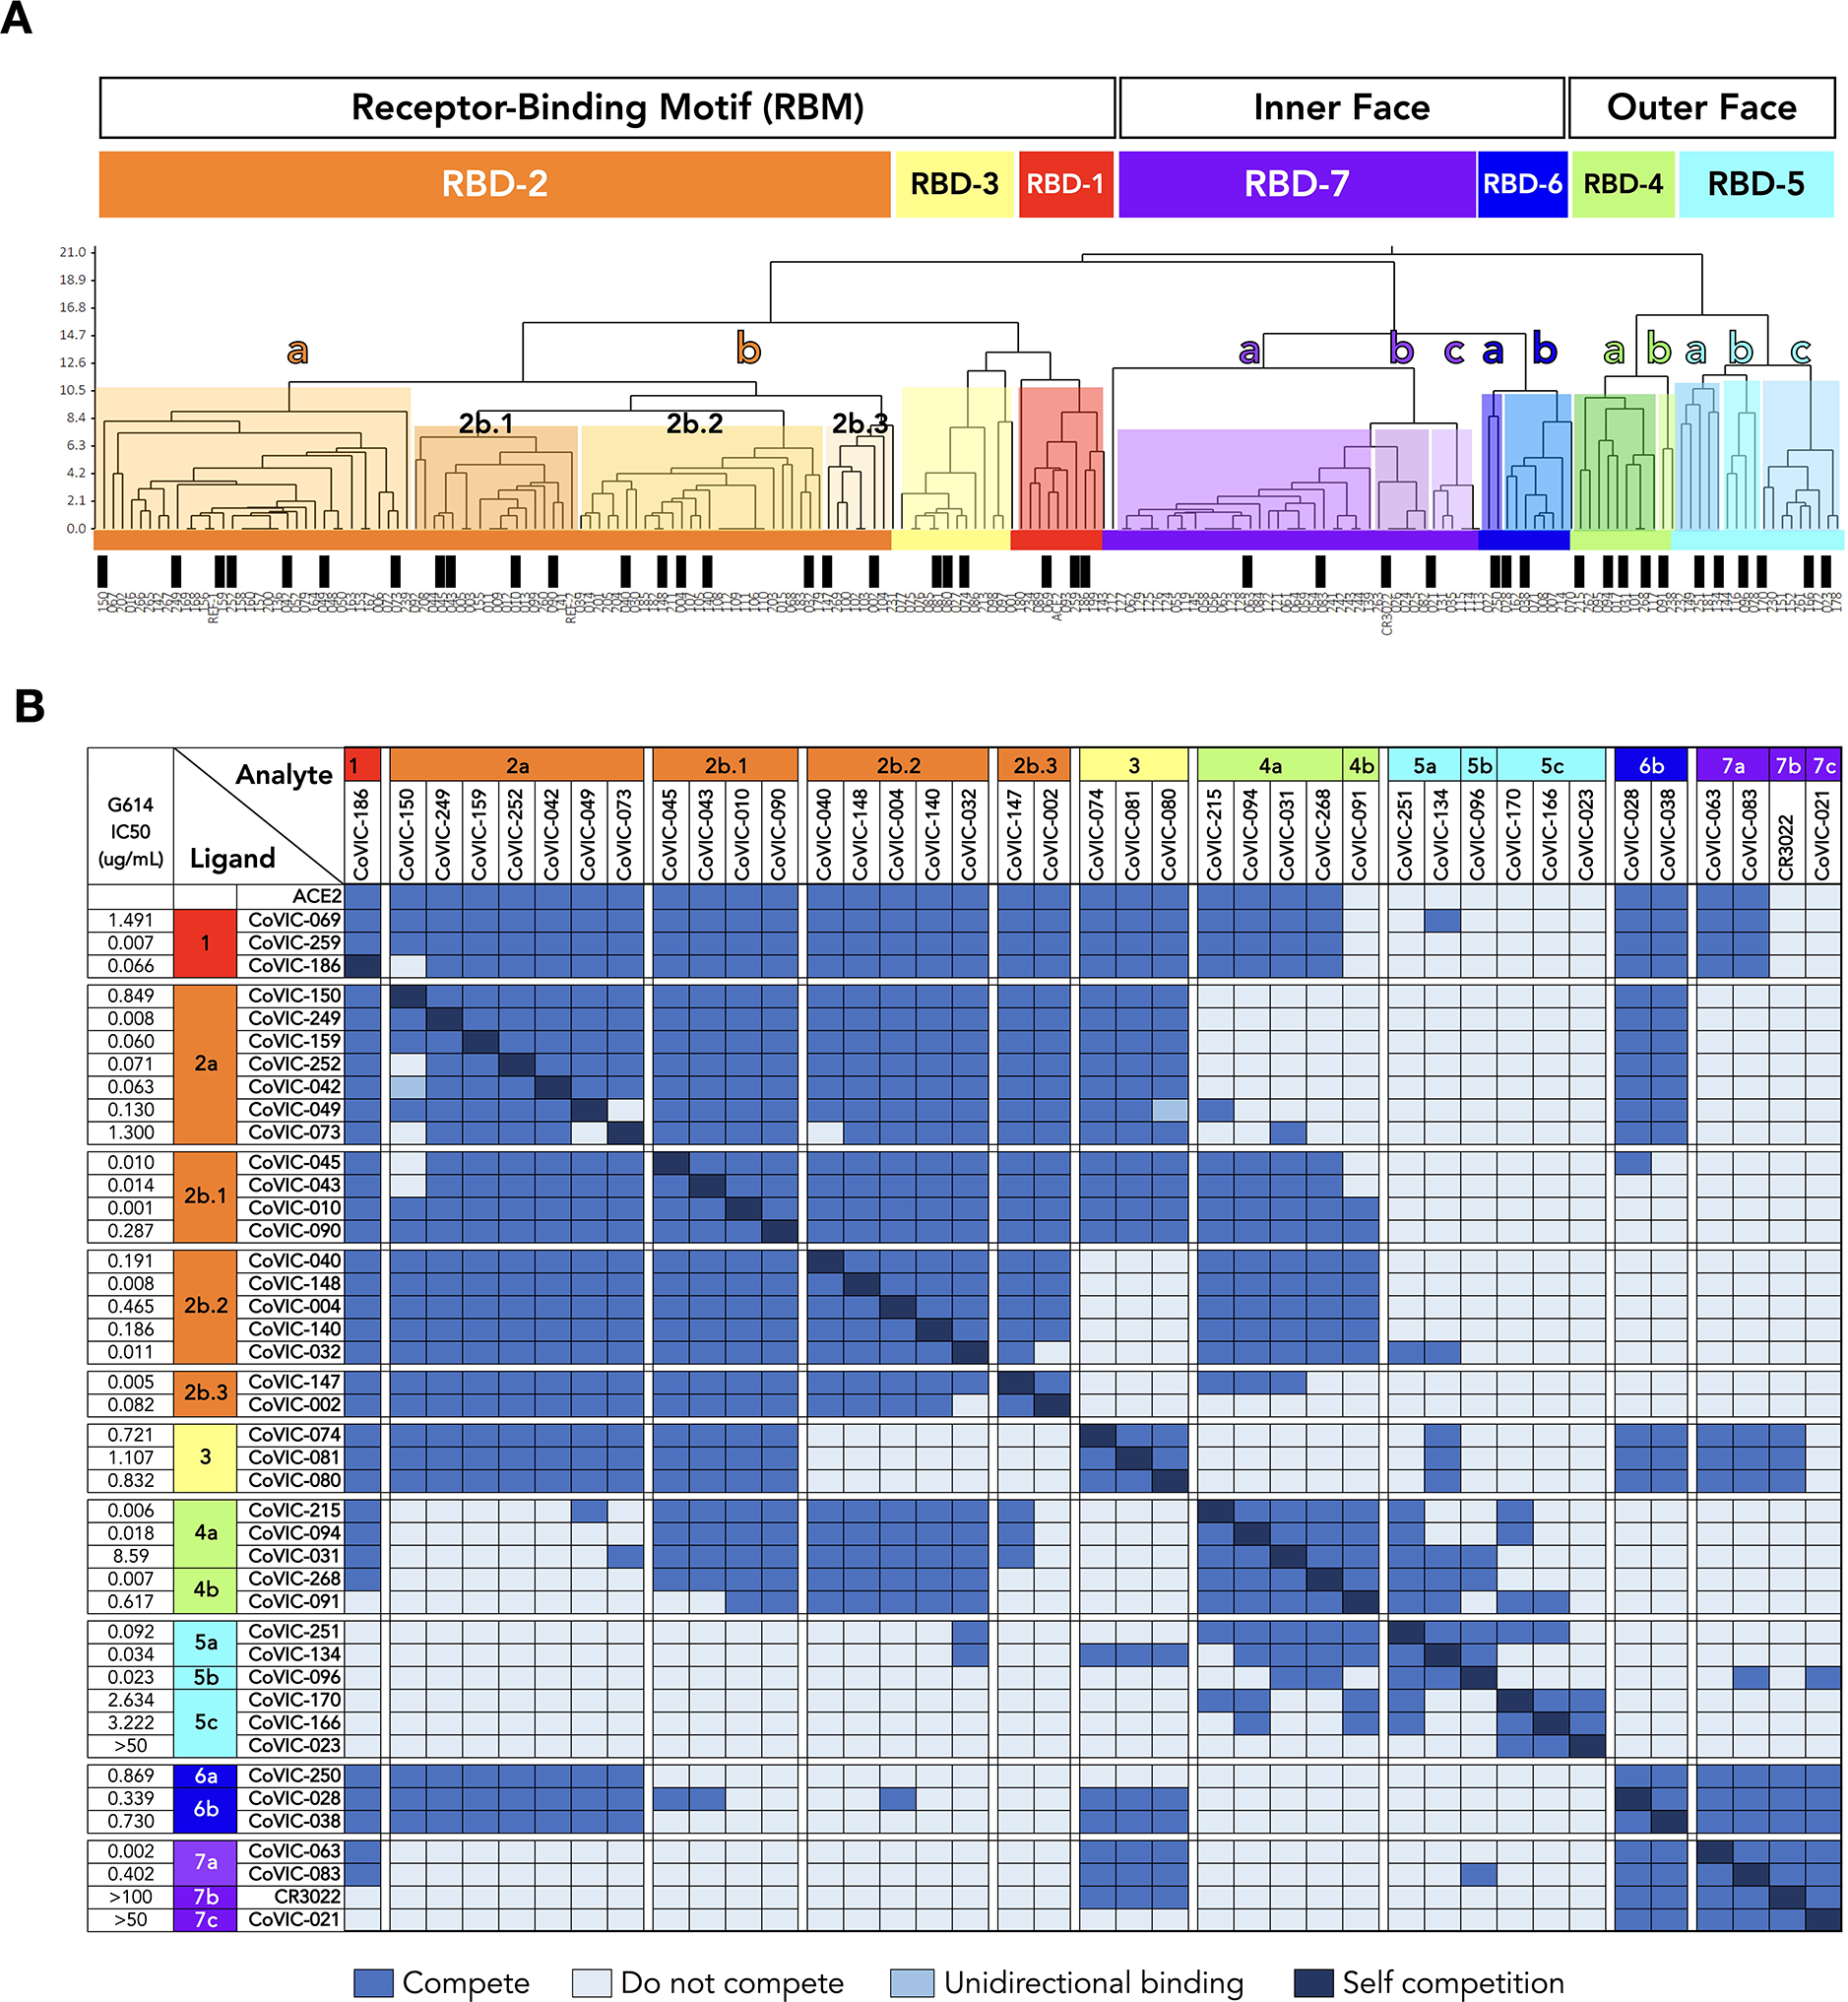
A. High-throughput SPR was used to determine the competitive relationship between 186 RBD-directed mAbs. The dataset was analyzed by Carterra Epitope software to sort competition profiles of clones into related clusters, which are represented as shared colored regions of the dendrogram. The RBD epitope landscape can be broadly divided into seven communities containing mAbs that bind the receptor-binding motif (RBD-1 through RBD-3), the outer face of the RBD (RBD-4 and RBD-5) or the inner face of the RBD (RBD-6 and RBD-7). Communities can be further divided into smaller clusters (e.g., RBD-2a and −2b) and bins (e.g., RBD-2b.1, −2b.2 and −2b.3) based on their discrete competition with other clusters and/or their ability to compete with ACE2 for Spike binding. Black bars indicate single clones that were used in further analyses. Table S1 lists additional metrics for the indicated mAbs (i.e., ACE2 blocking, kinetic analyses and germline information) and detailed information for the entire CoVIC panel is at covic.lji.org. B. Binary heat-map matrix demonstrating the competition profile for the finer clusters and bins for the subset of single clones indicated by black bars in panel A. The matrix here contains representative examples. The complete competition matrix for the study is in Table S2. RBD-2 can be divided into clusters “a” and “b”, which have varying ability to compete with mAbs in RBD-4 (e.g., RBD-2a mAbs do not compete while most RBD-2b mAbs do). Cluster RBD-2b can be divided into three smaller bins that vary in their competition with both RBD-3 and RBD-4 mAbs: those in 2b.1, but not 2b.2 or 2b.3, compete with RBD-3 mAbs whereas mAbs in 2b.1 and 2b.2, but not 2b.3, compete with RBD-4 mAbs. RBD-4 contains mAbs that do (RBD-4a) and do not (RBD-4b) compete with ACE2. RBD-5 and RBD-7 have clusters of mAbs with lower neutralizing potency (i.e., RBD-5c and RBD-7b and RBD-7c) relative to the other cluster in the same community (i.e., RBD-5a and RBD-5b and RBD-7a). Rows and columns indicate the immobilized mAb and injected analyte mAb, respectively. Table S2 shows the complete matrix for competition between all 186 mAbs.