
Fig. 2. Negative stain EM analysis of representatives from each RBD-directed community.
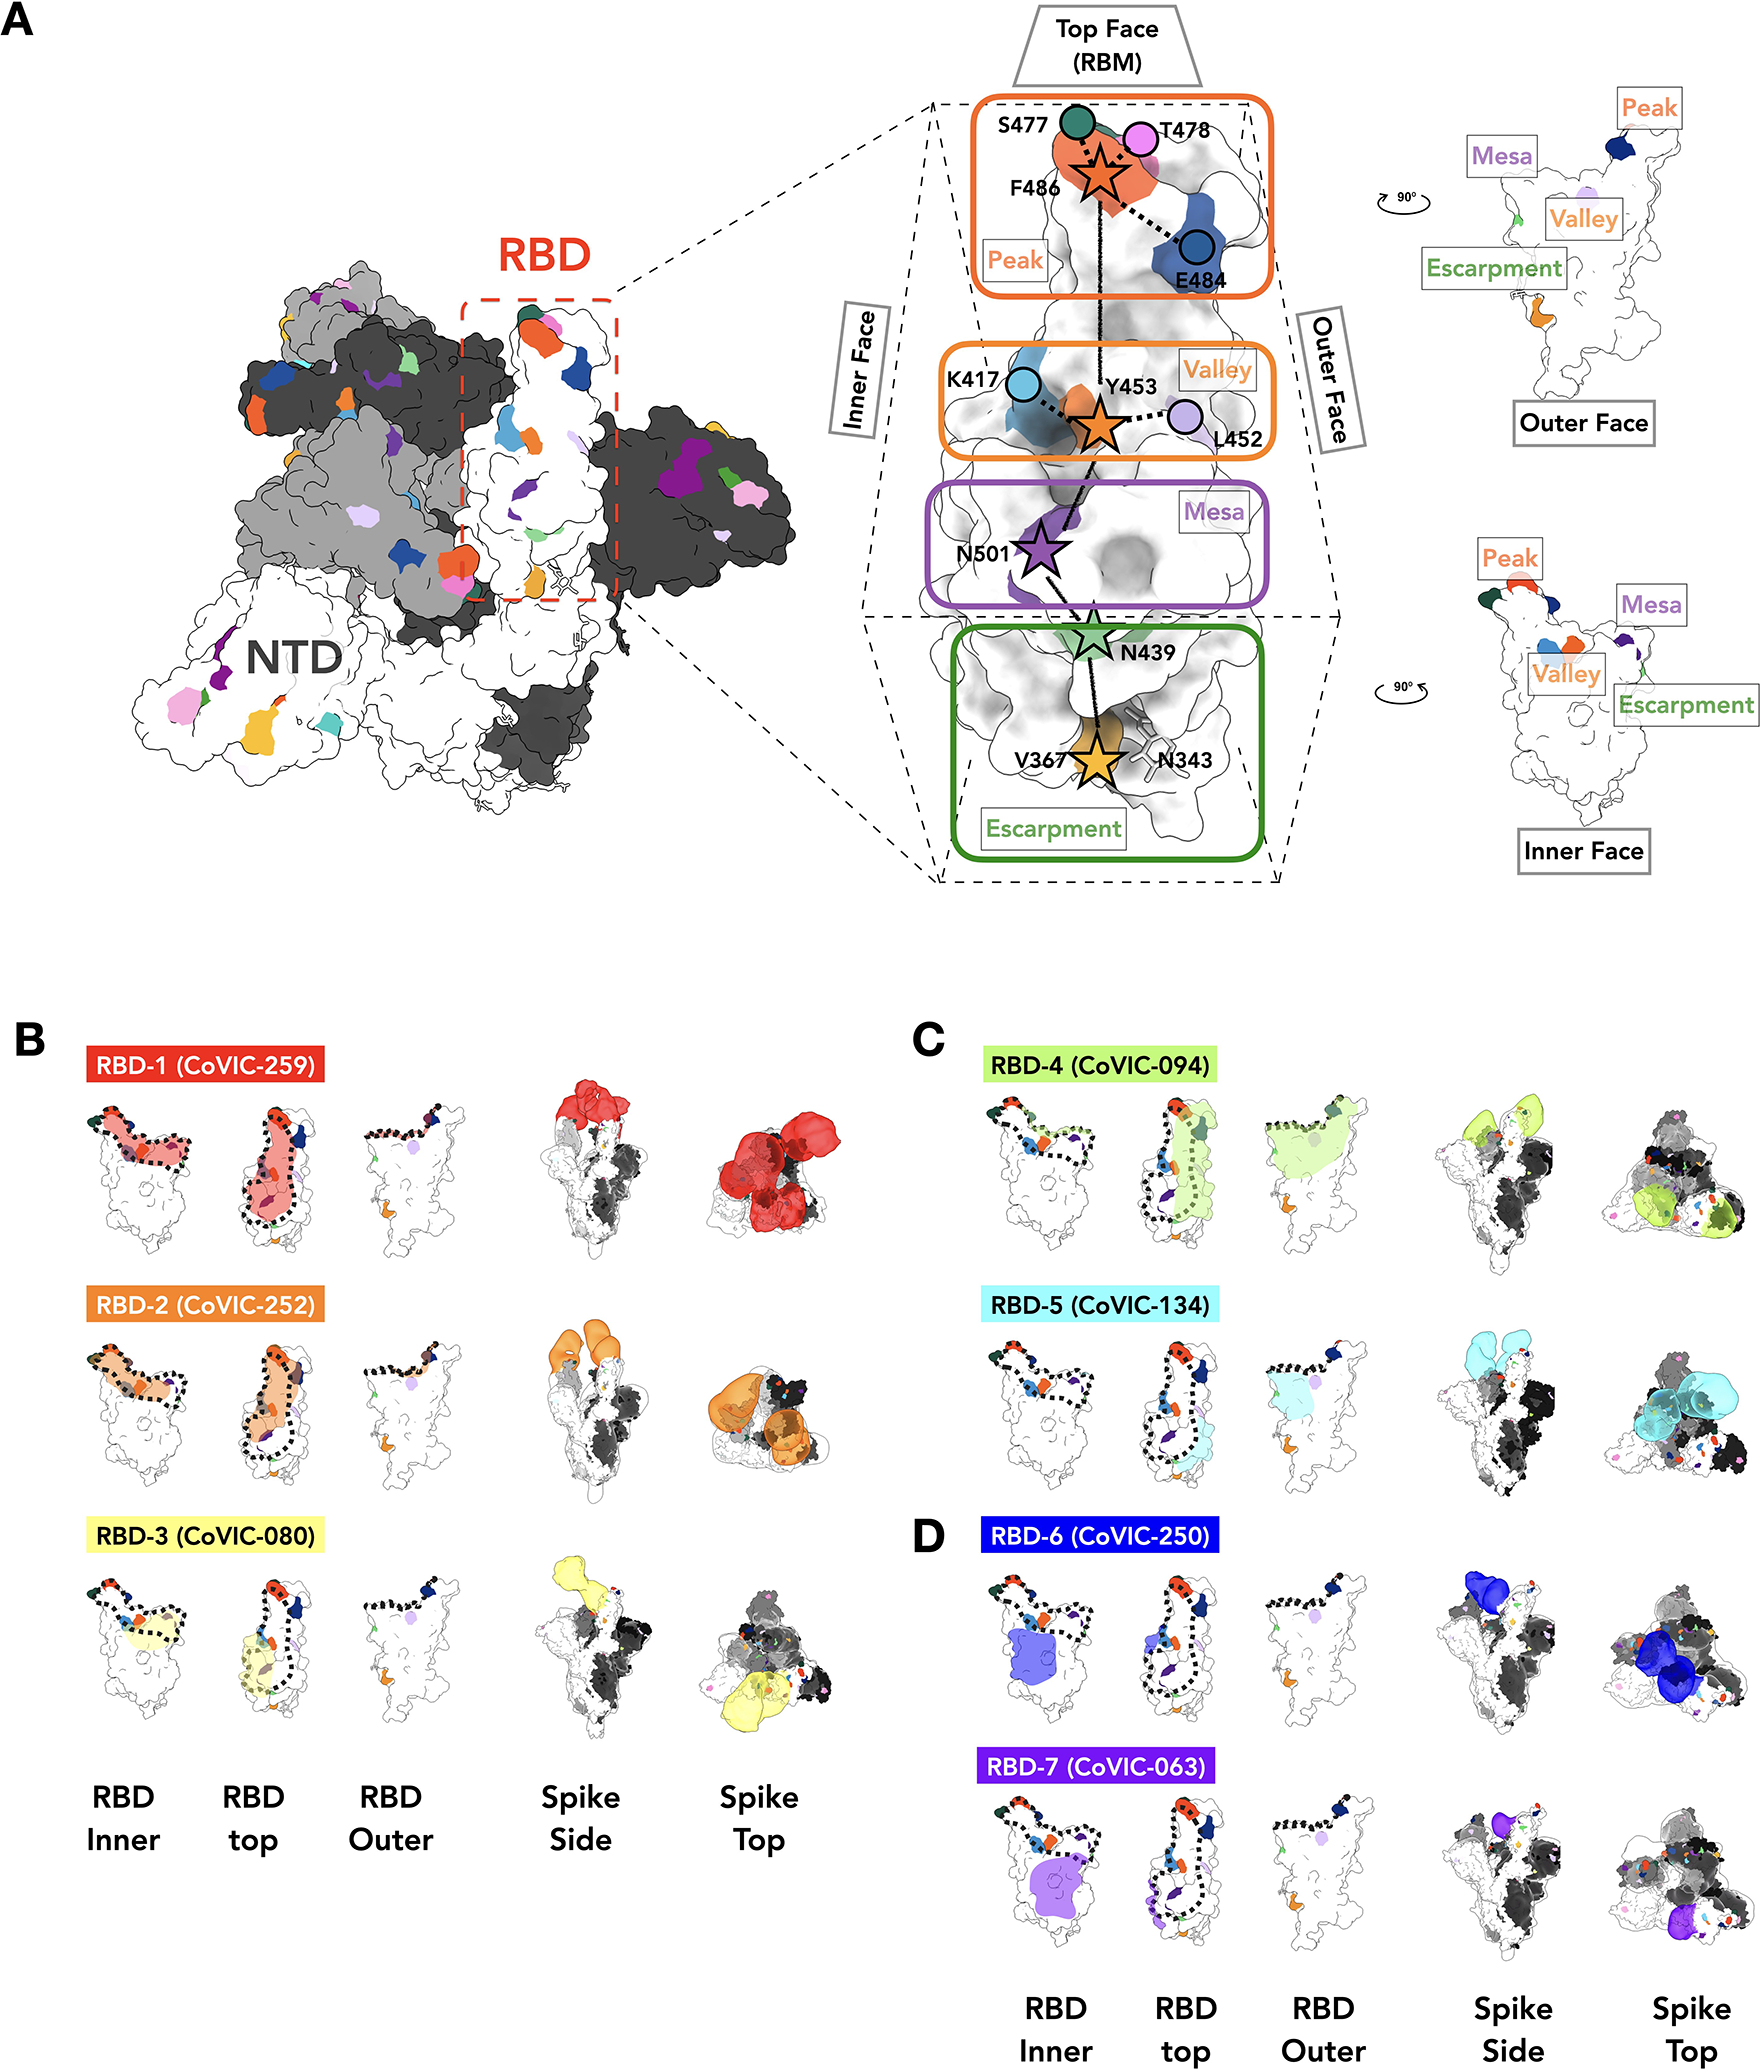
A. The location of important emerging mutations in RBD. The Spike trimer (adapted from PDB: 7A94 (39)) viewed from the top with one RBD “up” RBD, is shown, with individual Spike monomers colored white, gray and black. The RBM can be topologically divided into three subsections: the “Peak” that includes residues F486, S477, T478 and E484, the “Valley” including residues Y453, K417 and L452 and the “Mesa” with residue N501. Stars indicate residues on the central axis of RBD. The “Outer Face” (exposed in the RBD down/closed conformation), and “Inner Face” (buried inside the trimer in the RBD down/closed conformation) define the lateral faces of RBD and “Escarpment” (contains residues V367, N439 and glycan 343). B. NS-EM footprint of a representative antibody from each community mapped onto an RBD monomer. The colored shading corresponds to the community colors in Figure 1. The ACE2 binding site is outlined with a dotted line. Side and top views of Spike trimers show the Fab approach angle and binding stoichiometry for each representative. Table S3 shows NS-EM data for all 29 RBD-directed mAbs analyzed.