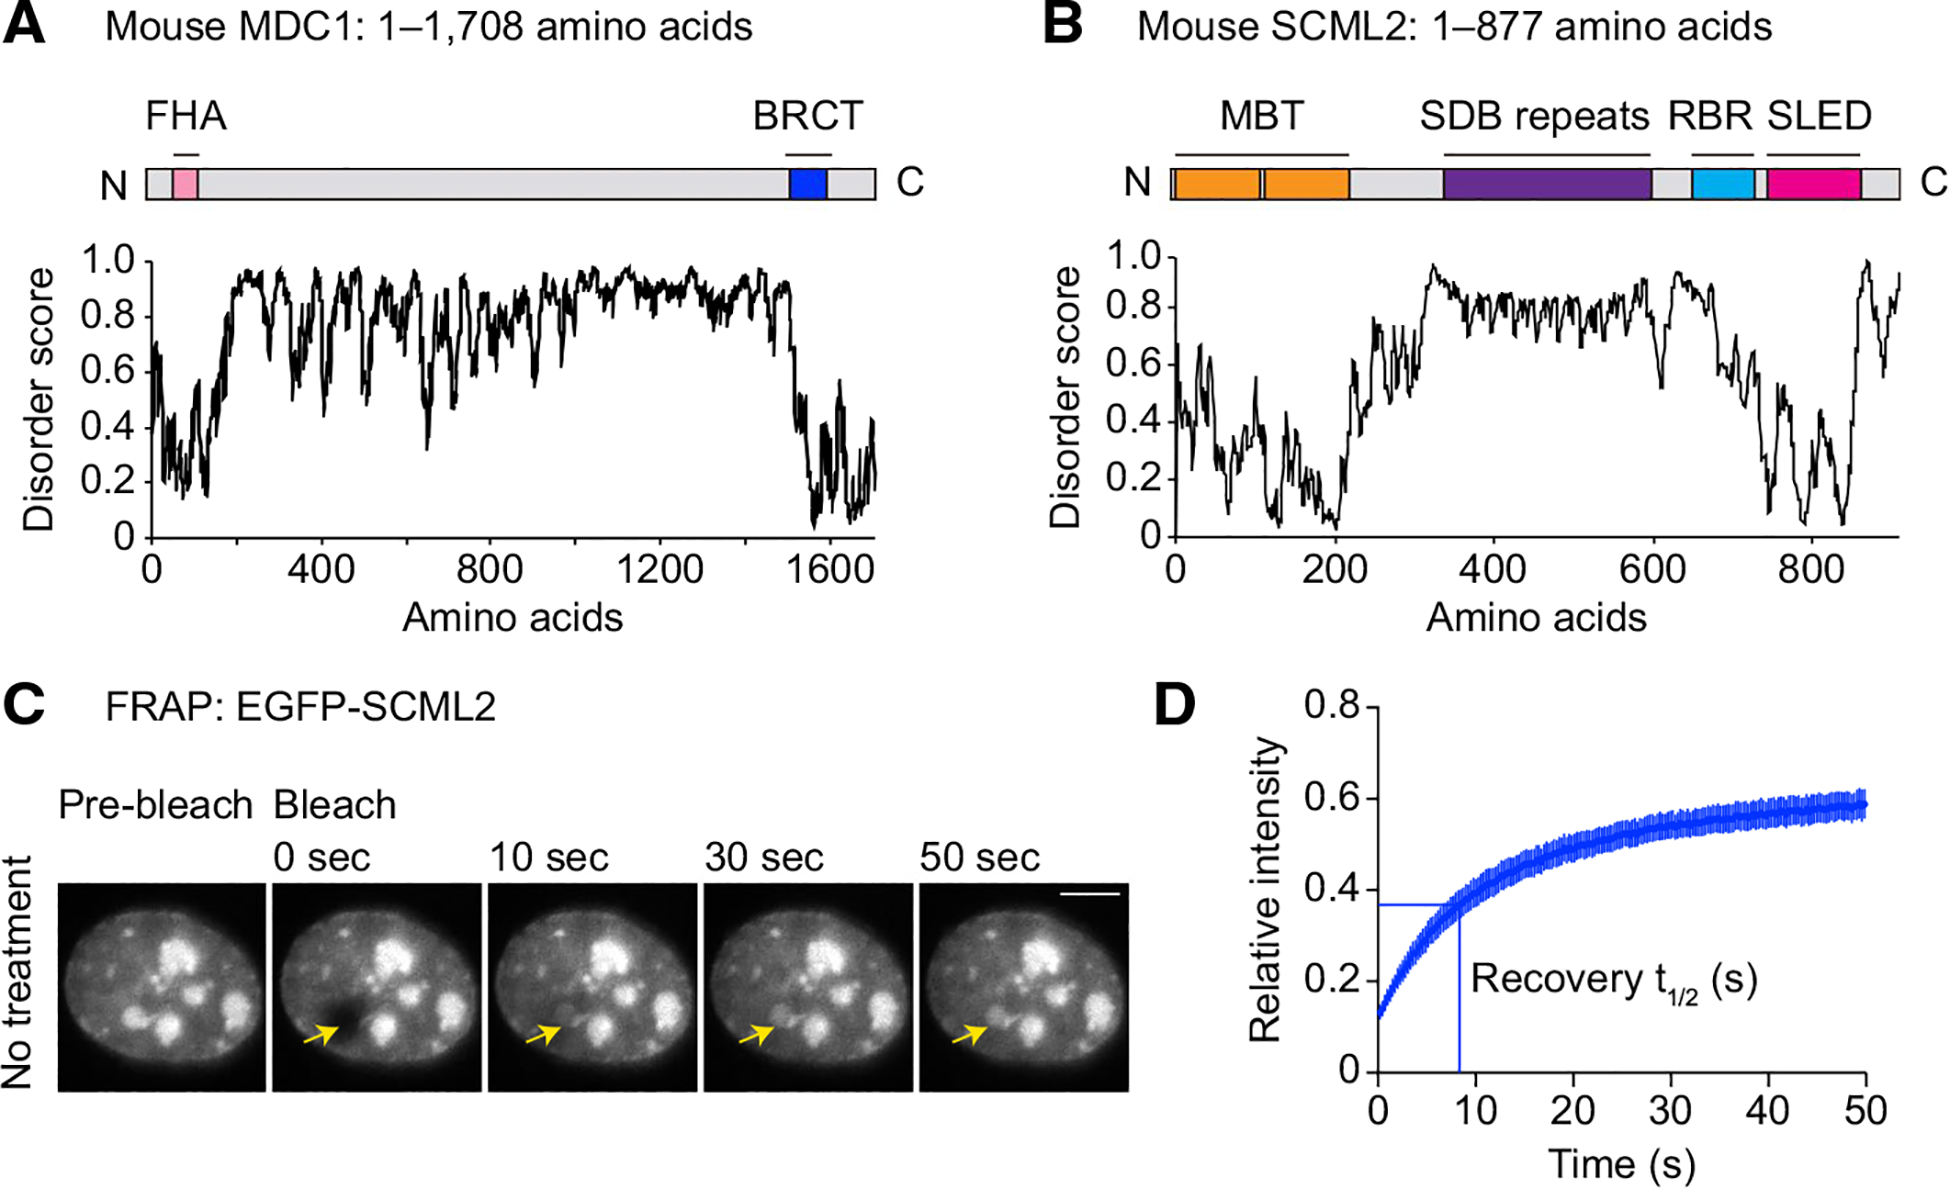
Fig. 4.

A phase separation hypothesis for the initiation of MSCI and for XY-body formation. A, B Predictions of protein disorder in MDC1 (A) and SCML2 (B; IUPRED score, Dosztányi et al., 2018 [161]). C Representative live images of FRAP assays in mK4 cells expressing EGFP-SCML2. Bars: 5 μm. The images are originally from Maezawa et al., 2018 [140]. Arrows show the site of photobleaching. D Relative intensity from FRAP assays of full-length SCML2. Recovery represents 50% of the plateaued intensity: t1/2 (s). Error bars for FRAP curves and recovery t1/2 represent 95% confidence intervals of the mean. The data are originally from Maezawa et al. 2018 [140]
