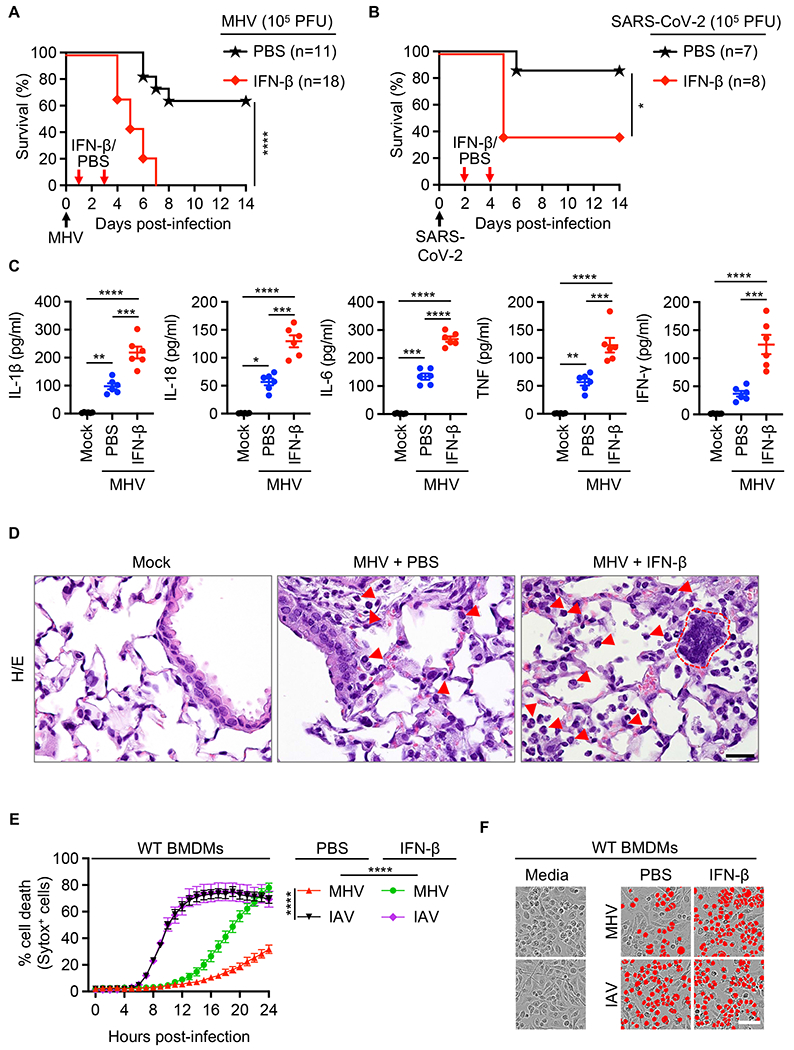
Fig. 2. IFN-β treatment drives lethality, cytokine storm and cell death during β-oronavirus infection.

(A) Survival of 6- to 12-week-old wild type (WT) mice treated with PBS (n = 11) or IFN-β (n = 18) on day 1 and 3 after intranasal infection with mouse hepatitis virus (MHV). (B) Survival of 6- to 12-week-old WT mice treated with PBS (n = 7) or IFN-β (n = 8) on day 2 and 4 after intranasal infection with SARS-CoV-2. (C) Analysis of IL-1β, IL-18, IL-6, TNF and IFN-γ levels in BALF of uninfected WT mice (mock, n = 6) or PBS- (n = 6) or IFN-β– (n = 6) treated WT mice 3 days after MHV infection. (D) Hematoxylin and eosin (H/E) staining of lung samples from WT mice 3 days after MHV infection (PBS- or IFN-β–treated) or no infection (mock). Arrows indicate infiltrating immune cells and dotted red outline represents a syncytial cell. (E) Real-time analysis of cell death in PBS- or IFN-β–treated WT bone marrow-derived macrophages (BMDMs) after infection with MHV or influenza A virus (IAV). (F) Representative images of cell death in PBS- or IFN-β–treated BMDMs are shown at 24 h after MHV infection or 16 h after IAV infection. Scale bar, 50 μm (D, F). Data are representative of two (A, C, D) or at least three independent experiments (E, F). *P < 0.05, **P < 0.01, ***P < 0.001 and ****P < 0.0001. Analysis was performed using the one-way ANOVA (C, E) or log-rank test (Mantel-Cox) (A, B). Each symbol represents one mouse (C). Data are shown as mean ± SEM. Images are representative of an experiment containing at least 5 biologically independent samples in each group (D).
