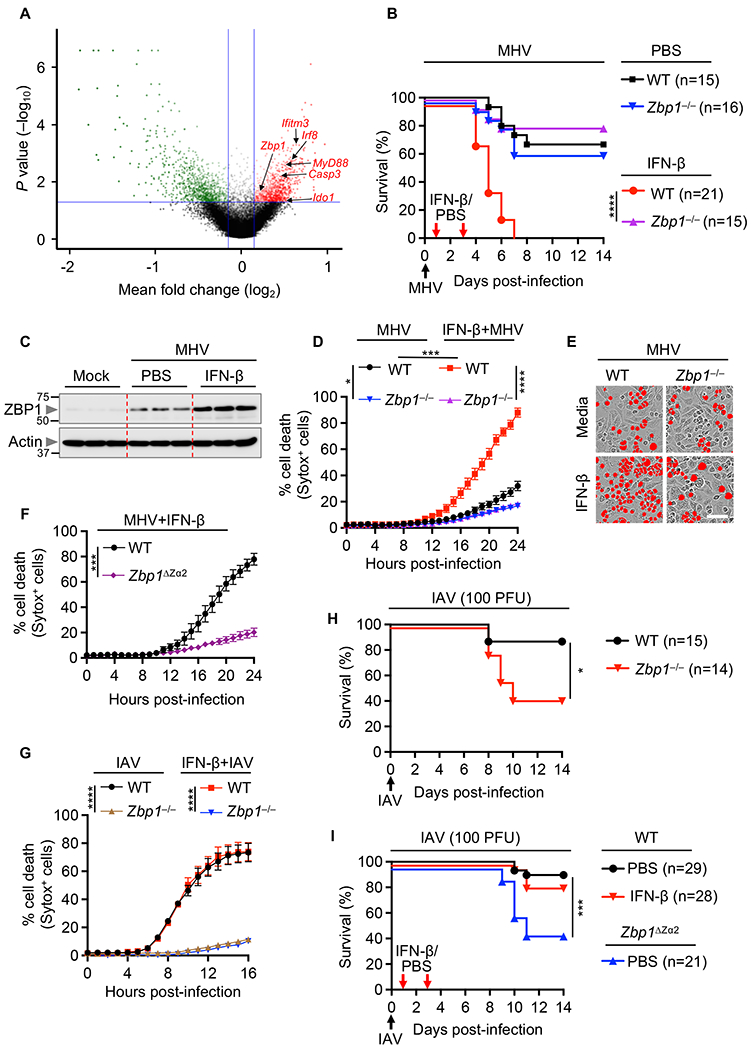
Fig. 4. IFN-β–driven lethality, cytokine storm and cell death depend on ZBP1 during β-coronavirus infection.

(A) Volcano plot showing the genes that are enriched or depleted in immortalized bone marrow-derived macrophages (iBMDMs) following a genome-wide CRISPR/CAS9 knockout screen of cell death induced by mouse hepatitis virus (MHV) infection (MOI 0.2, 24 h). (B) Survival of 6- to 12-week-old wild type (WT) and Zbp1−/− mice treated with PBS (n = 15 for WT and n = 16 for Zbp1−/− mice) or IFN-β (n = 21 for WT and n = 15 for Zbp1−/− mice) on day 1 and 3 after intranasal infection with MHV. (C) Immunoblot analysis of ZBP1 in the lung samples from PBS- or IFN-β–treated WT mice 3 days after MHV infection. Molecular weight marker sizes in kDa are indicated in small font on the left of each blot. Actin was used as the internal control. (D) Real-time analysis of cell death in MHV-infected WT or Zbp1−/− BMDMs in the presence or absence of IFN-β. (E) Representative images of cell death in media- or IFN-β–treated WT or Zbp1−/− BMDMs are shown at 24 h after MHV infection. Scale bar, 50 μm. (F) Real-time analysis of cell death in MHV-infected WT or Zbp1ΔZa2 BMDMs in the presence of IFN-β. (G) Real-time analysis of cell death in influenza A virus (IAV)-infected WT or Zbp1−/− BMDMs in the presence and absence of IFN-β. (H) Survival of 6- to 12-week-old WT (n = 15) and Zbp1−/− (n = 14) mice after intranasal infection of IAV. (I) Survival of 6- to 12-week-old WT and Zbp1ΔZa2 mice treated with PBS (n = 29 for WT and n = 21 for Zbp1ΔZa2 mice) or IFN-β (n = 28 for WT mice) on day 1 and 3 after intranasal infection of IAV. Survival data are pooled from 2 infection experiments (B, H, I). All other data are representative of at least three independent experiments. *P < 0.05, ***P < 0.001 and ****P < 0.0001. Analysis was performed using the one-way ANOVA (D, G), two-tailed t test (F) or log-rank test (Mantel-Cox) (B, H, I). Data are shown as mean ± SEM.
