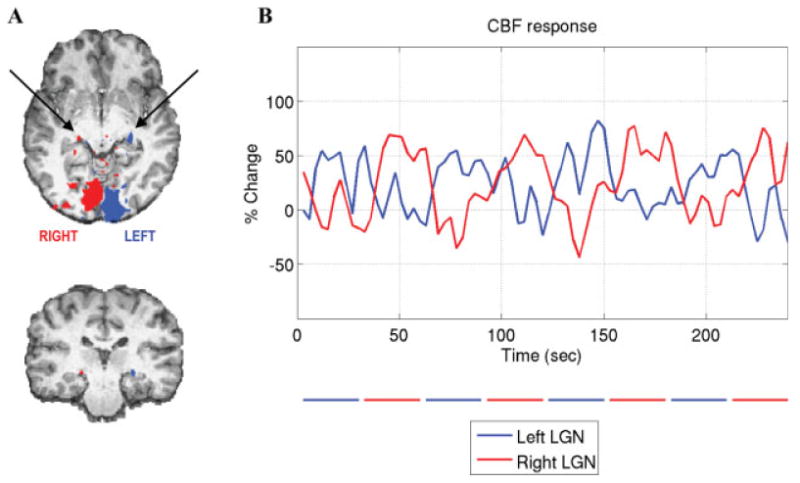
Figure 1.

A: Subject 1's CBF activation map (P < 0.05 corrected for multiple comparisons) superimposed on the anatomical image. Activation within the primary visual cortex and the LGN (indicated by the arrows) can be seen. B: CBF time courses averaged over active voxels within the left (blue) and right (red) LGN functional ROIs. The blue and red bars below the graph indicate the periods of visual stimulation presented to the contralateral visual fields. [Color figure can be viewed in the online issue, which is available at www.interscience.wiley.com.]
