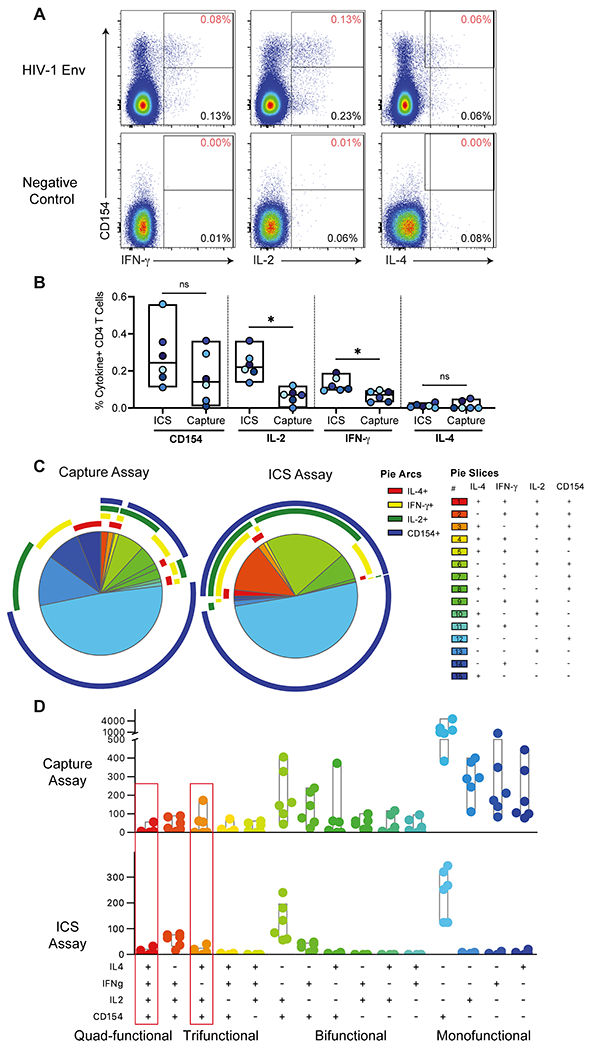
Figure 1. Comparison of env-specific CD4+ T cell responses post-vaccination by multiplexed cytokine capture and ICS assays.

A) Example of multiplexed cytokine capture assay env and negative control stimulations of PBMC from a HVTN 097 vaccine recipient. Data is gated on CD4+ T lymphocytes (live single, CD56−, CD19−, CD14−, CD3+, CD4+ and CD8−). The Y-axis shows CD154 expression, and the X-axis shows: IFN-γ (left), IL-2 (middle), and IL-4 (right). The percentage in the bottom right of each plot indicates the frequency of cytokine positive events and the percentage in the top right (in red) of each plot is the percentage of CD4 T cells that are co-expressing the indicated cytokine with CD154. B) Background-subtracted percent of CD4 T cells expressing CD154, IFN-γ, IL-2, and IL-4 for each subject by multiplexed cytokine capture and ICS assays (n=6). Significance determined using Wilcoxon Rank test. * indicates p value < 0.05. C) Pie charts show the median distribution of subsets among the env-specific CD4 T cells. Each pie slice indicates the proportion of env-specific CD4 T cells that expressing those cytokines (indicated in the legend) and color-coded by the degree of polyfunctionality: monofunctional (blue), bi-functional (green), tri-functional (yellow/orange) and quad-functional (red). The pie arc colors allow visualization of the functions expressed by each slice. D) Bar chart of the per subject counts of env-specific CD4+ T cell subsets by functional profile from ICS (out of a median of 556 total number of env-specific CD4+ T cells per subject) or multiplexed cytokine capture assay (out of a median of 1,887 total number of env-specific CD4+ T cells per subject) and color-coded by the degree of polyfunctionality. The red boxes indicate the two subsets that correlated with reduced risk of HIV infection in the RV144 vaccine trial.
