
Figure 2. Individual genes that are differentially expressed by polyfunctional env-specific CD4 T cells.
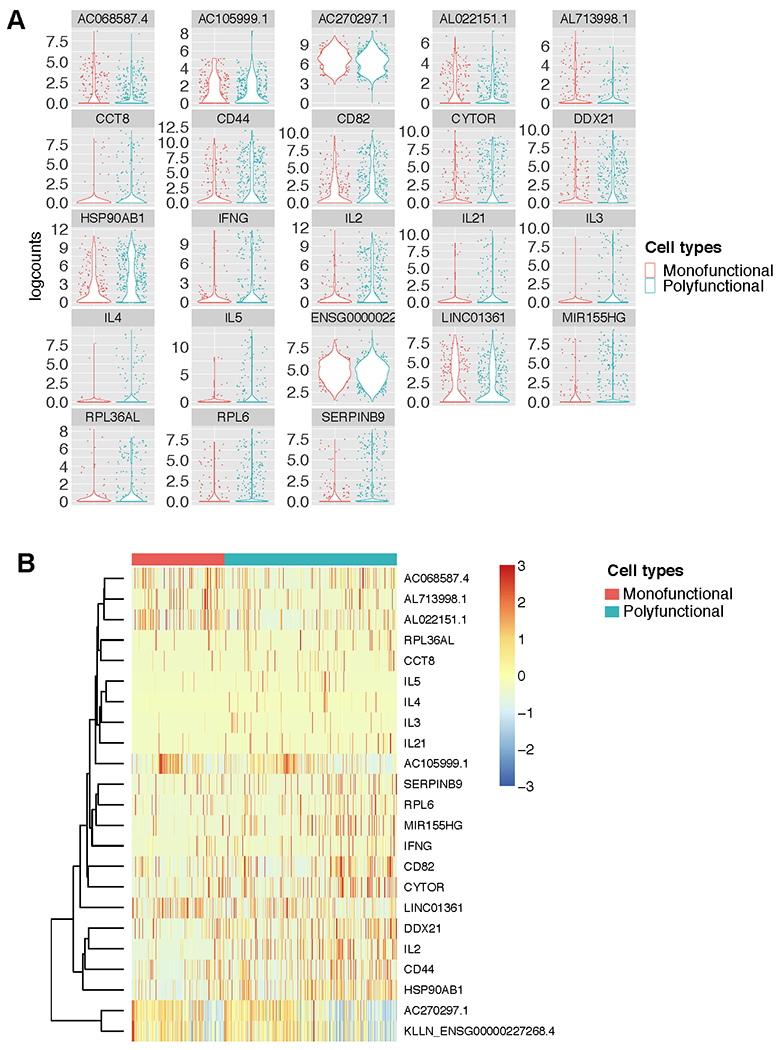
A) Violin plots of logcounts (log2-transformed normalized counts plus a pseudo-count of 1) of the genes that were significantly differentially expressed between monofunctional (producing only 1 cytokine/function) and polyfunctional (producing 2 or more cytokines/functions) env-specific CD4+ T cells. B) Heatmap of z-scores (mean row-centered log2-counts per million) of the same differentially expressed genes the clustered by polyfunctionality profile.