
Figure 2.
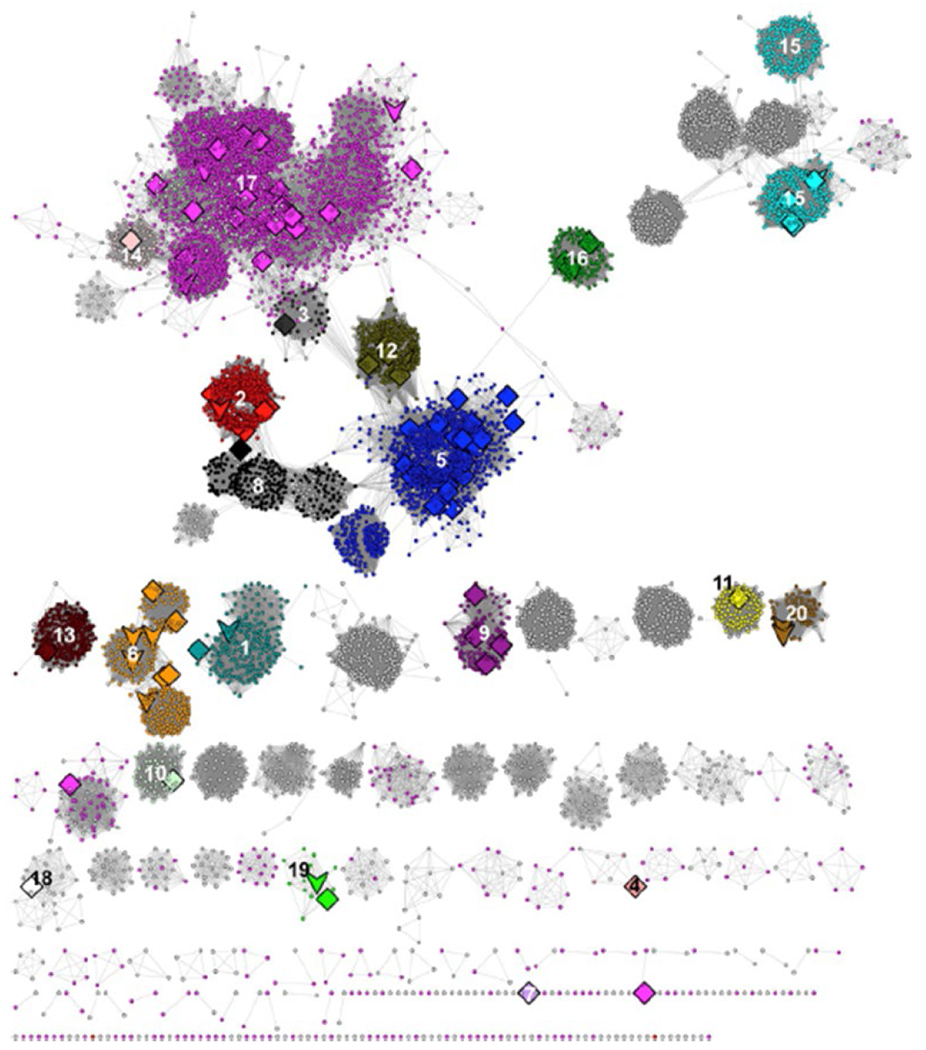
The SSN generated with a maximum e-value edge threshold of 1e-20 used by the SFLD to identify its 20 functionally characterized subgroups (colored/numbered clusters) and 22 uncharacterized subgroups. Large nodes represent experimentally characterized proteins: downward arrows indicate a structurally characterized protein; diamonds indicate no structural characterization. Reproduced with permission from reference 9; http://www.elsevier.com