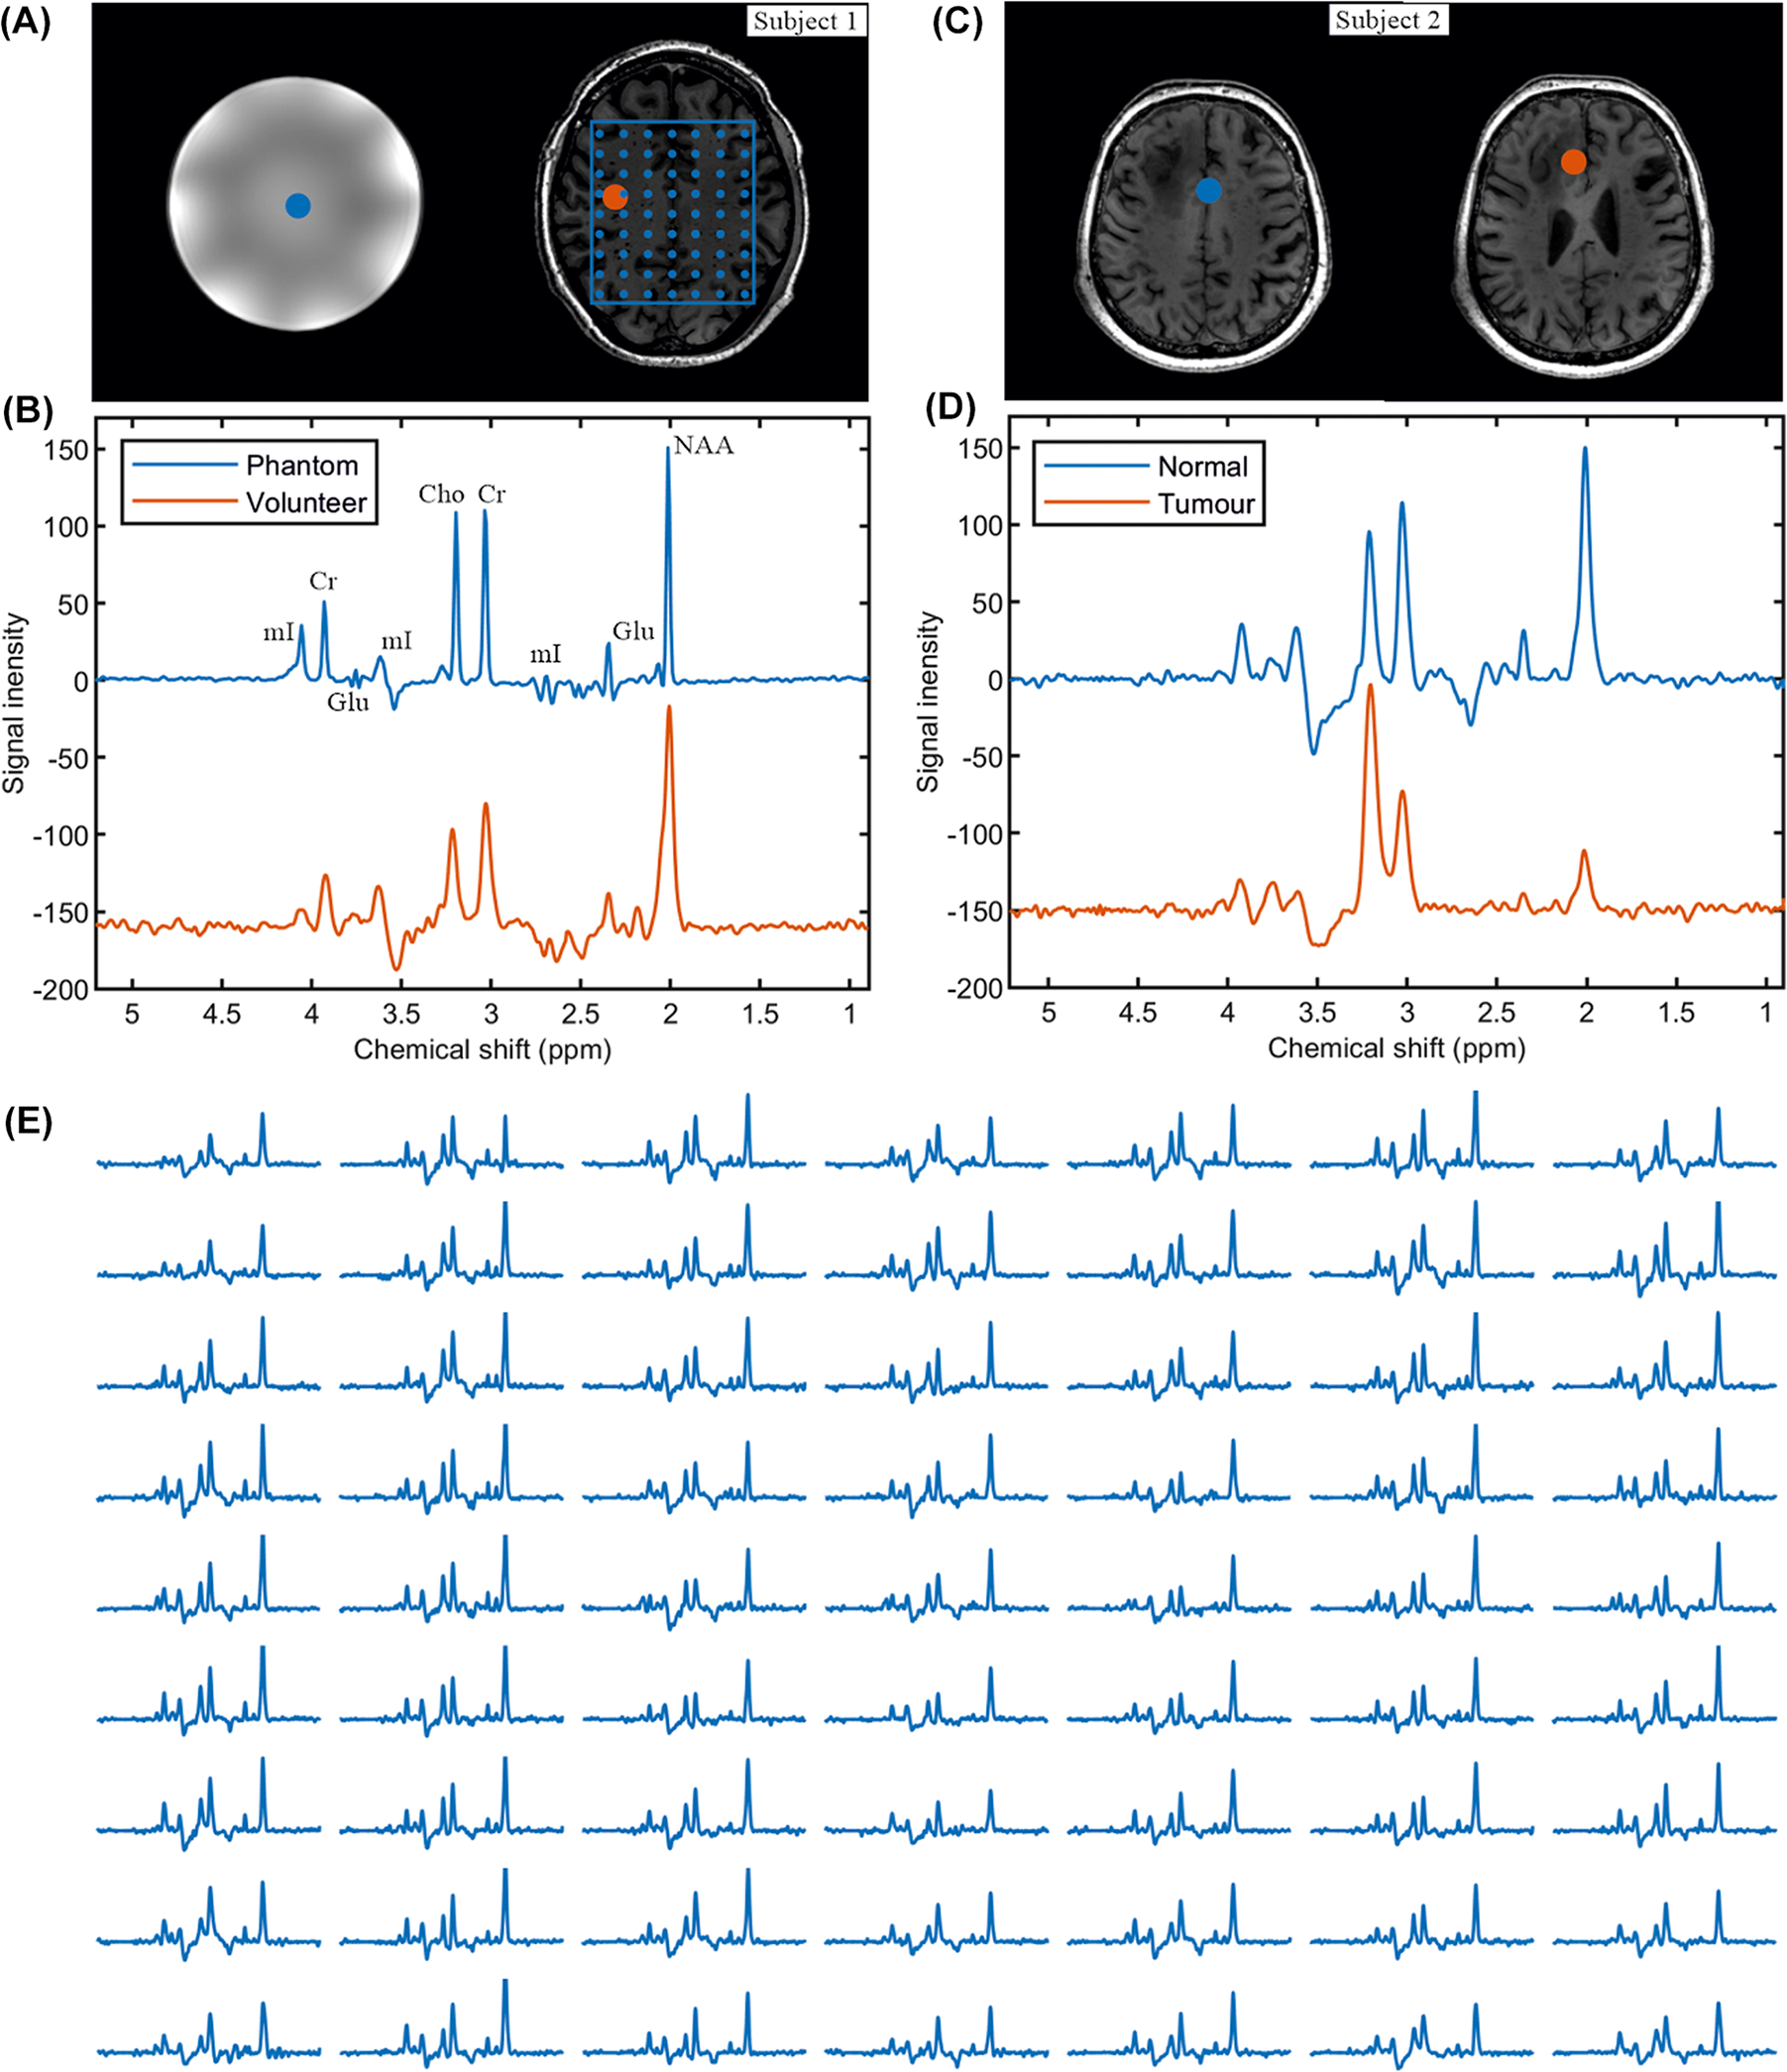
FIGURE 3.

In vitro and in vivo measurement. A, T1-weighted MRI of a Braino phantom and healthy volunteer. B, 2π-CSAP-EPSI of the Braino phantom (see the Methods section) and healthy volunteer where the selected volumes are indicated with blue and orange dots. The 2π-CSAP-EPSI is performed with TE = 82 ms, TR = 1551 ms, BW = 0.81 kHz, matrix = 65 × 25 × 15 (4.3 × 7.2 × 7.3 mm), and measurement time = 8:31 min. C,D, T1-weighted and 2π-CSAP-EPSIs of a patient with currently unconfirmed tumor-type, with the selected volumes marked with blue and orange dots in the normal and tumor areas, respectively. The 2π-CSAP-EPSI was performed with TE = 82 ms, TR = 1551 ms, BW = 0.81 kHz, matrix = 65 × 28 × 14 (4.3 × 7.9 × 7.9 mm), and measurement time = 7:41 min. E, The array spectrum plots of selected area (indicated by blue line and dots in A). The different size of the blue and orange dots does not represent the different size of the displaced voxels, which is the same for all of them (4.3 × 4.3 × 7.9 mm)
