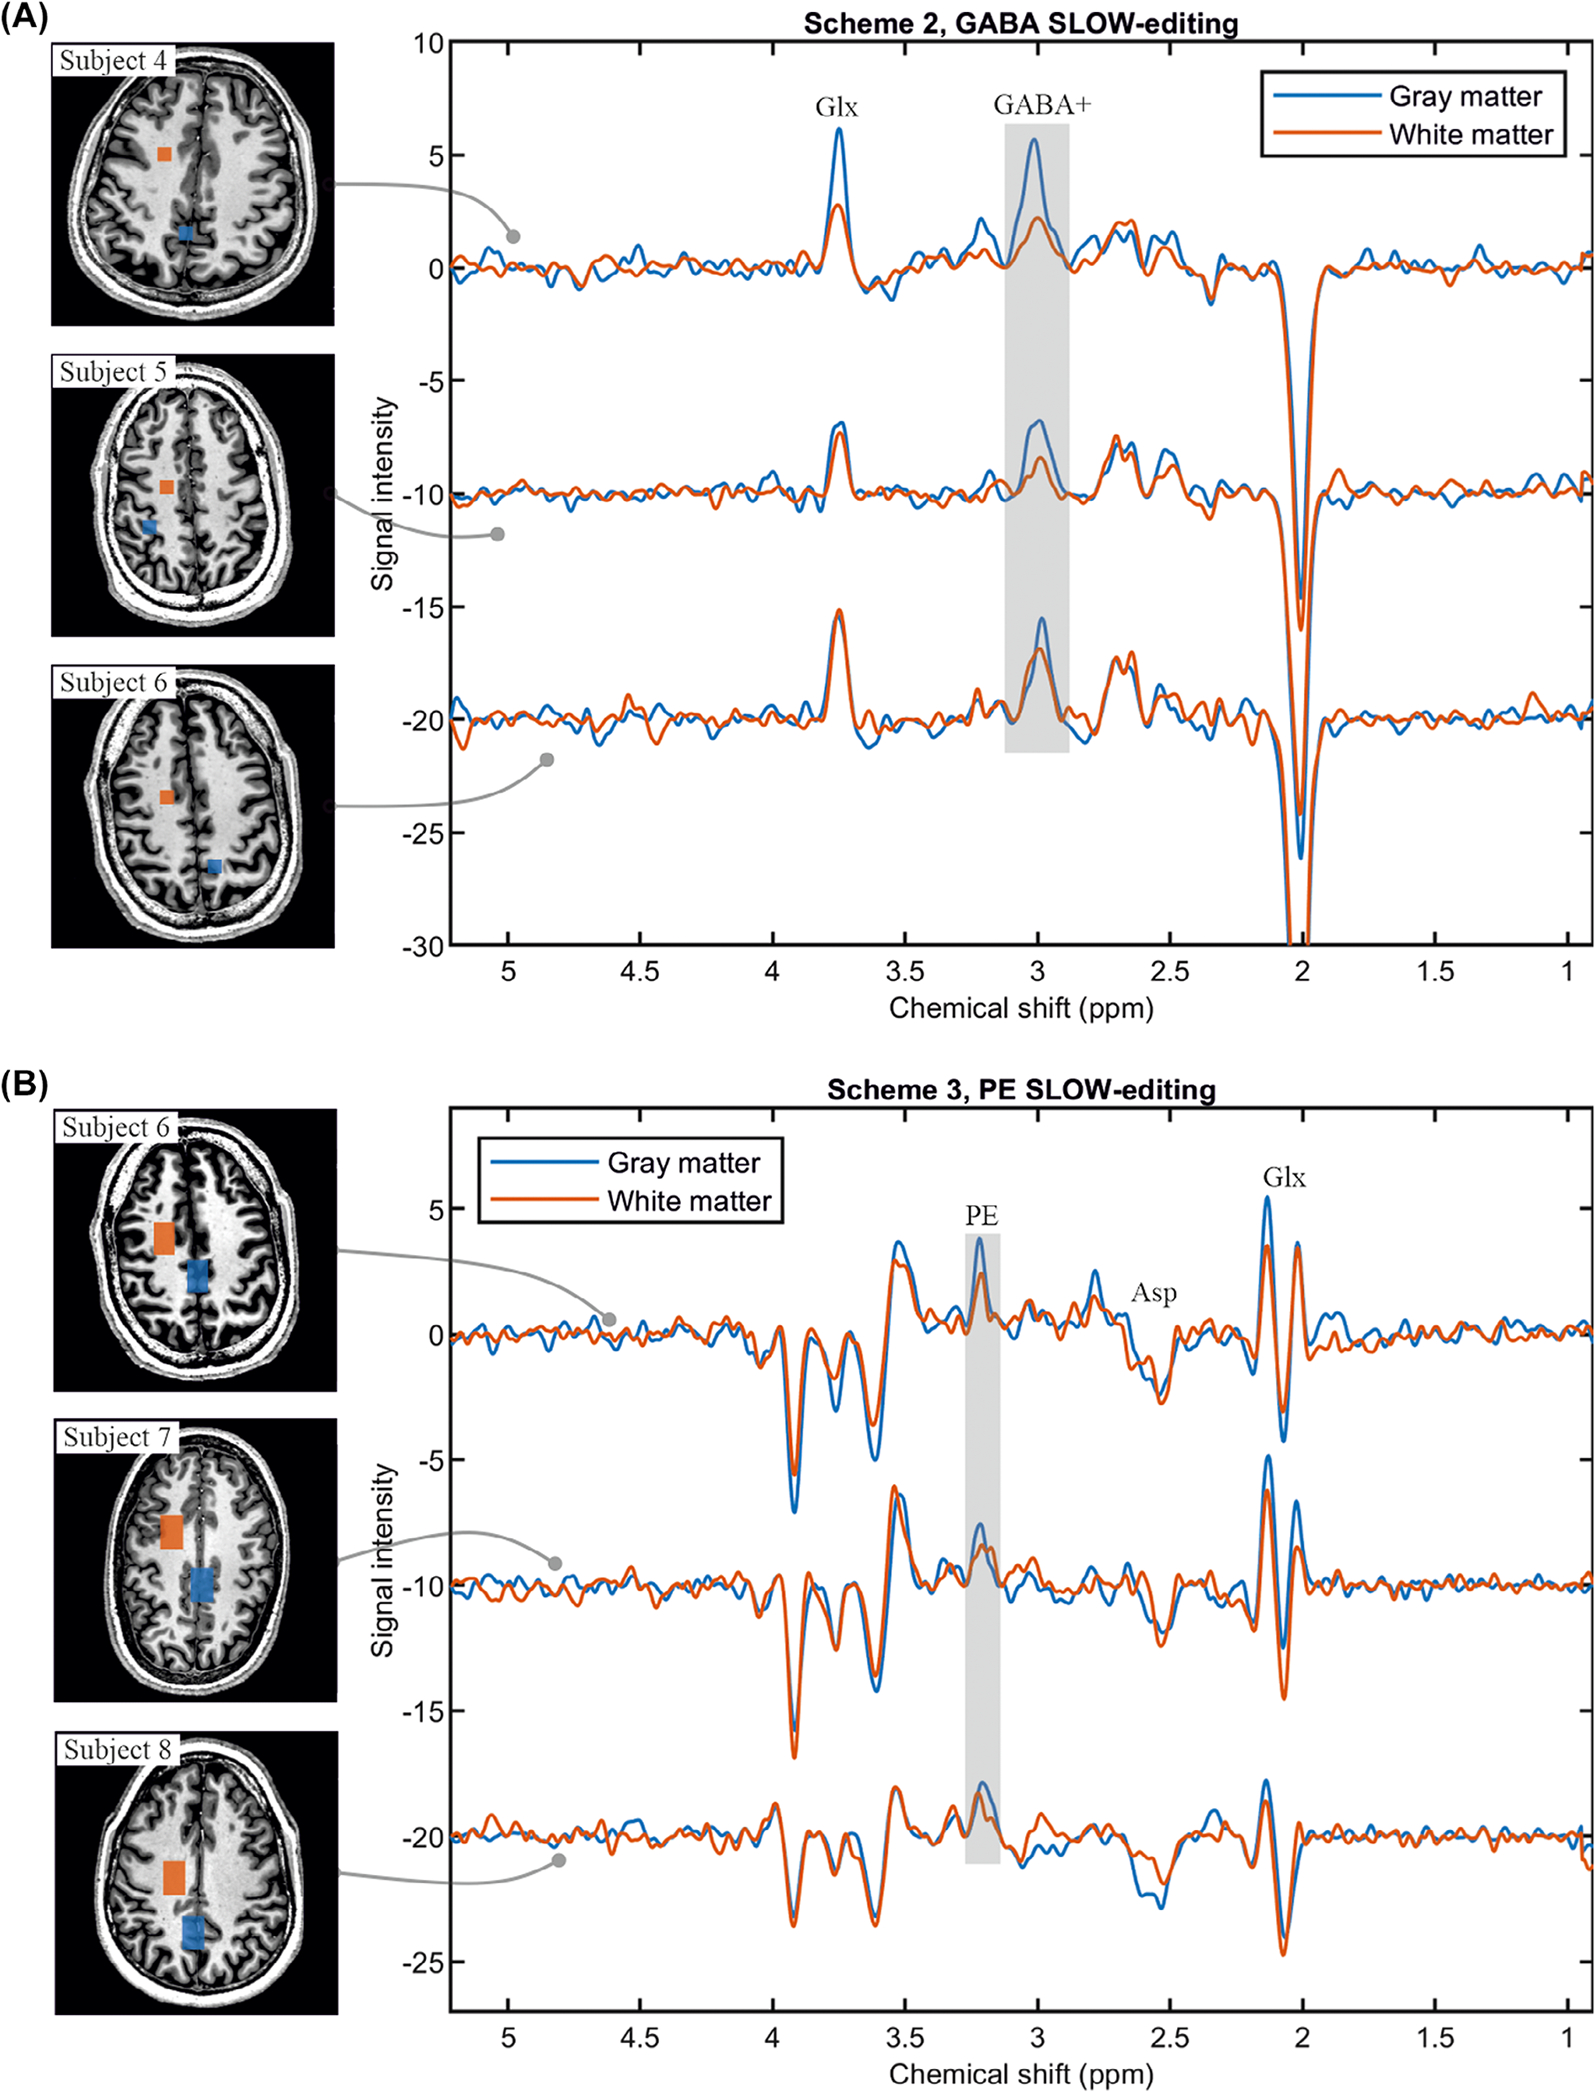
FIGURE 6.

In vivo measurement of GABA+ and PE using SLOW-editing scheme 2 and 3. A, GABA+-editing using editing scheme 2 (TE = 68 ms) in three healthy volunteers, the selected volumes (8.6 × 8.6 × 7.8 mm, 2 × 2 × 1 = 4 voxels) are indicated on the left T1-weighted MRI. The gray and white matter are marked as blue and orange, respectively. B, PE-editing using scheme 3 (TE = 90 ms) in three healthy volunteers, the selected volumes (12.9 × 21.5 × 7.8 mm, 3 × 5 × 1 = 15 voxels) are indicated on the left T1-weighted MRI. The gray and white matter are marked as blue and orange, respectively. TR = 1500 ms, data matrix = 65 × 23 × 9 (4.3 × 7.8 × 7.8 mm), and measurement time = 9:04 min
