
Figure 4: Diagram showing intermolecular interaction between bovine serum albumin and modified or unmodified fluorescent SHP144 peptide using fluorescence polarisation technique.
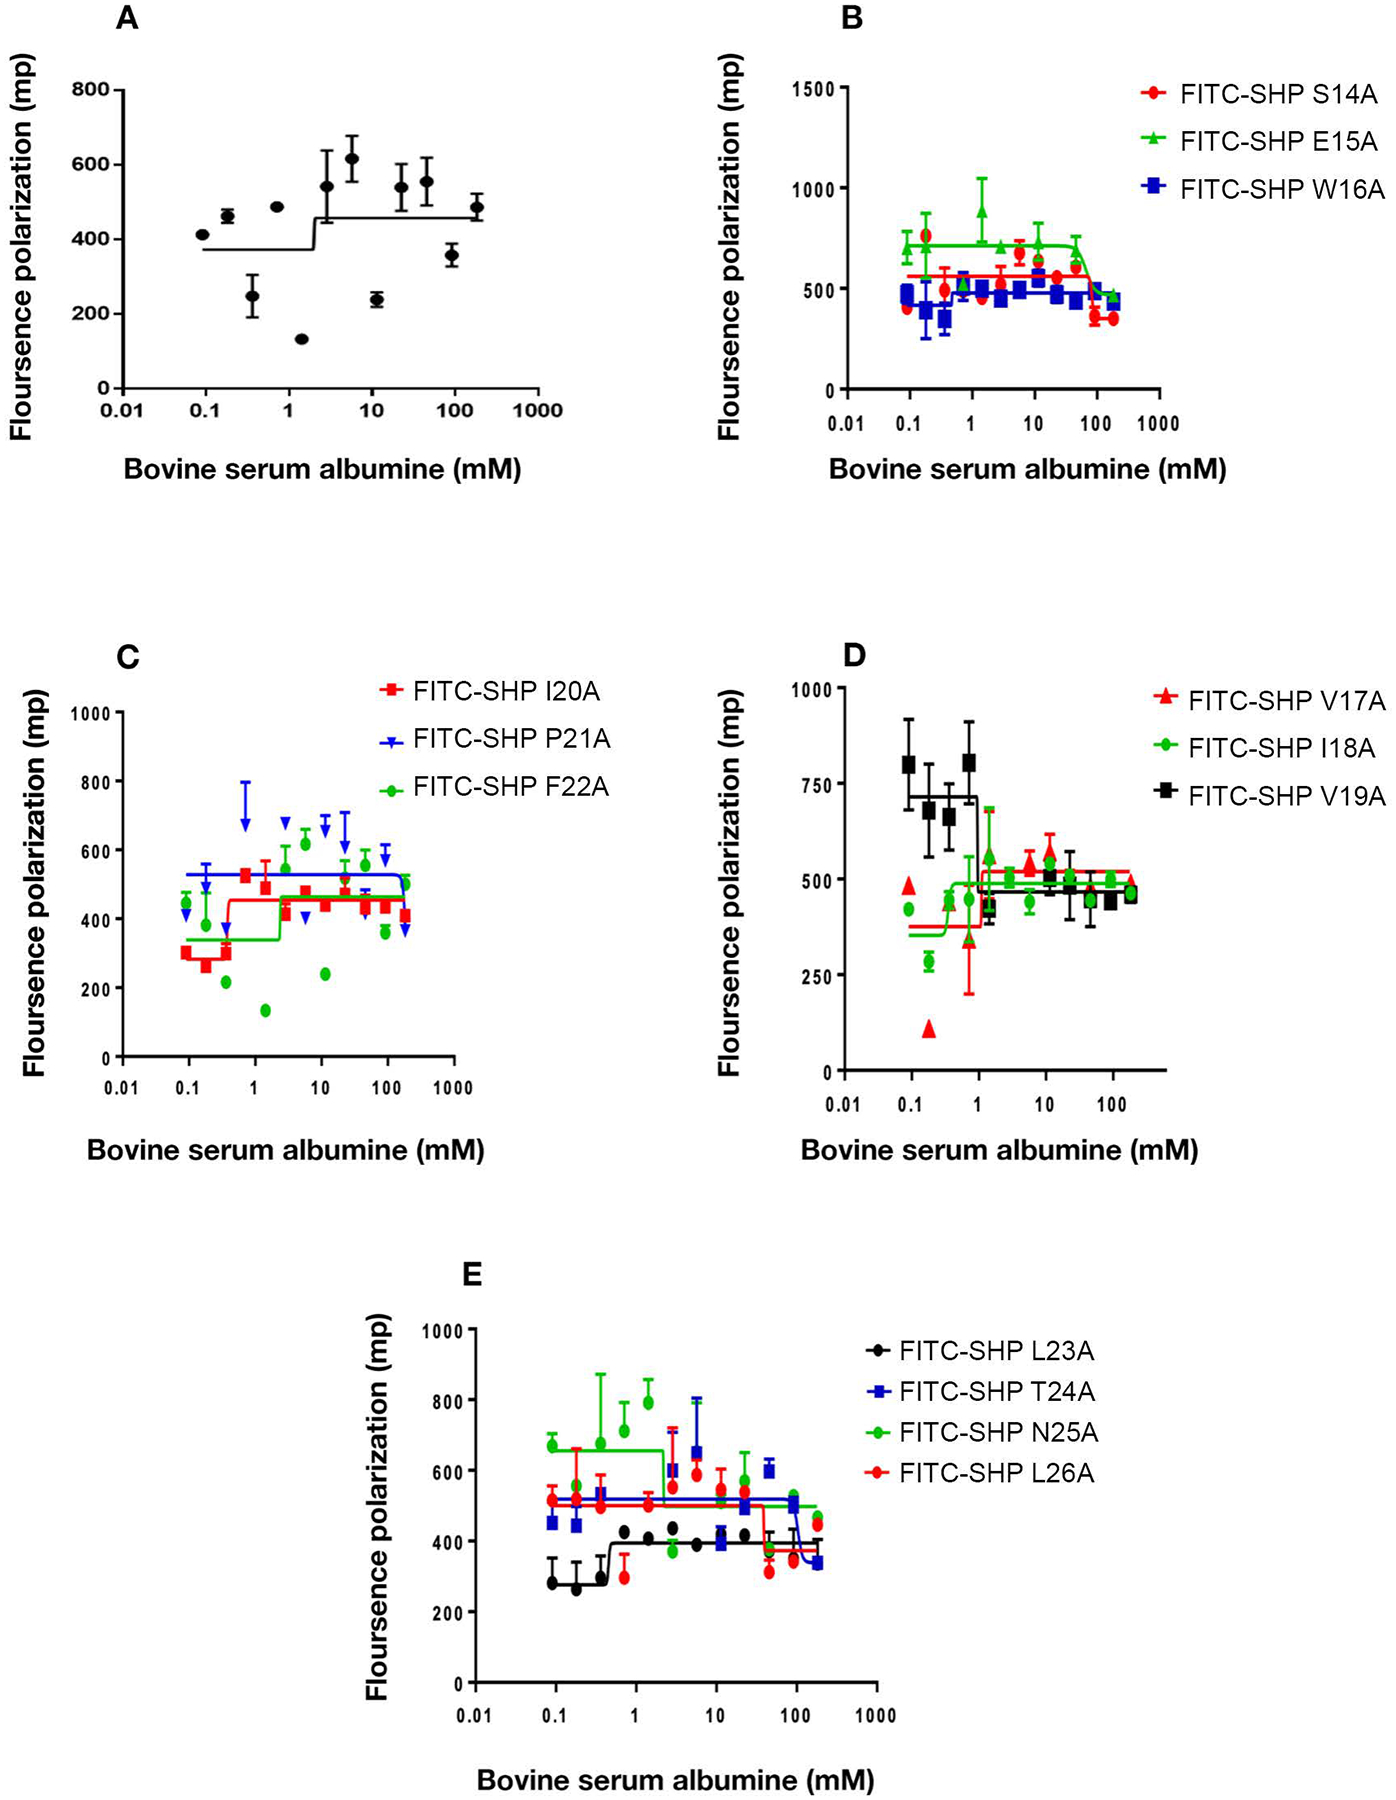
(A) indicates the binding of native FITC- SHP144 to BSA whereas (B-E) represent BSA interaction with modified FITC- SHP144 peptides. Polarisation values (mp) were measured using Hidex Sense Microplate Reader at excitation 485nm and emission 520nm, and each value was plotted against BSA concentration. The values represent the average of three independent experiments.