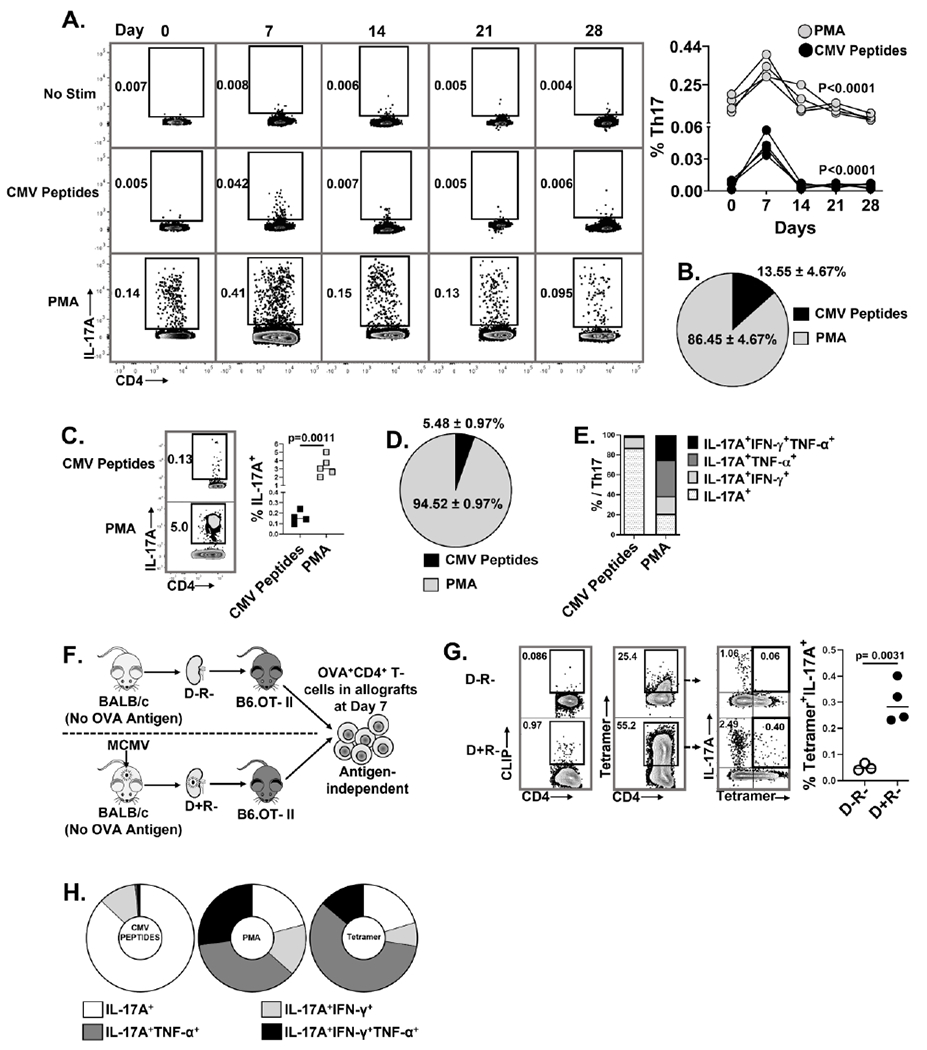
Figure 2. MCMV-specific and antigen-independent Th17 cells infiltrate virus infected allografts.

(A, B) Non-transplant B6 mice were infected with MCMV on Day 0 and splenic Th17 cell frequencies were quantified at days 0, 7, 14, 21, and 28 post-infection. Splenocytes were stimulated with either PMA or MCMV peptides and stained for IL-17A expressing CD4+ T- cells. (A) Representative flow plots showing frequencies of MCMV specific and PMA+ Th17 cells at indicated days; graph shows frequencies of PMA+ (gray circles) and MCMV-specific (black circles) Th17 cells over time. (B) Pie chart shows the percentages of MCMV-specific and PMA+ Th17 cells in non-transplant spleens at day 7 post-infection. (C) Representative flow plots and frequencies of CMV-specific (CMV peptides+) and total (PMA+) Th17 cells in allografts of D+R+ transplant recipients. (D) Pie chart shows percentages of MCMV-specific and PMA+ Th17 cells in D+R+ allografts. (E) Proportions of intragraft Th17 cells expressing IL-17A, IFN-γ and/or TNF-α, compared between Th17 cells responding to MCMV peptides or PMA in D+R+ allografts. (F) Experimental design. B6.OT-II transgenic recipients received D− or D+ allografts lacking expression of OVA antigen, so that OVA+ Th17 cells are recruited to allografts by antigen-independent mechanisms. (G) OVA-specific Th17 cells were detected using I-Ab-OVA323-339-APC tetramer staining, with human CLIP-APC tetramer used as control (Figure S3). Representative flow plots show tetramer staining of CD4+ T cells derived from D−R− and D+R+ allografts. Graph shows the frequencies of OVA tetramer+ Th17 cells compared between the groups. (H) Cytokine expression profiles were compared for intragraft MCMV specific and PMA+ Th17 cells in wild-type recipients, and for OVA tetramer+ Th17 cells from OTII recipients. Data are represented as mean ± standard deviation (SD) and are analyzed by two- sided Student’s t-test (C, G) or one- way ANOVA (A).
