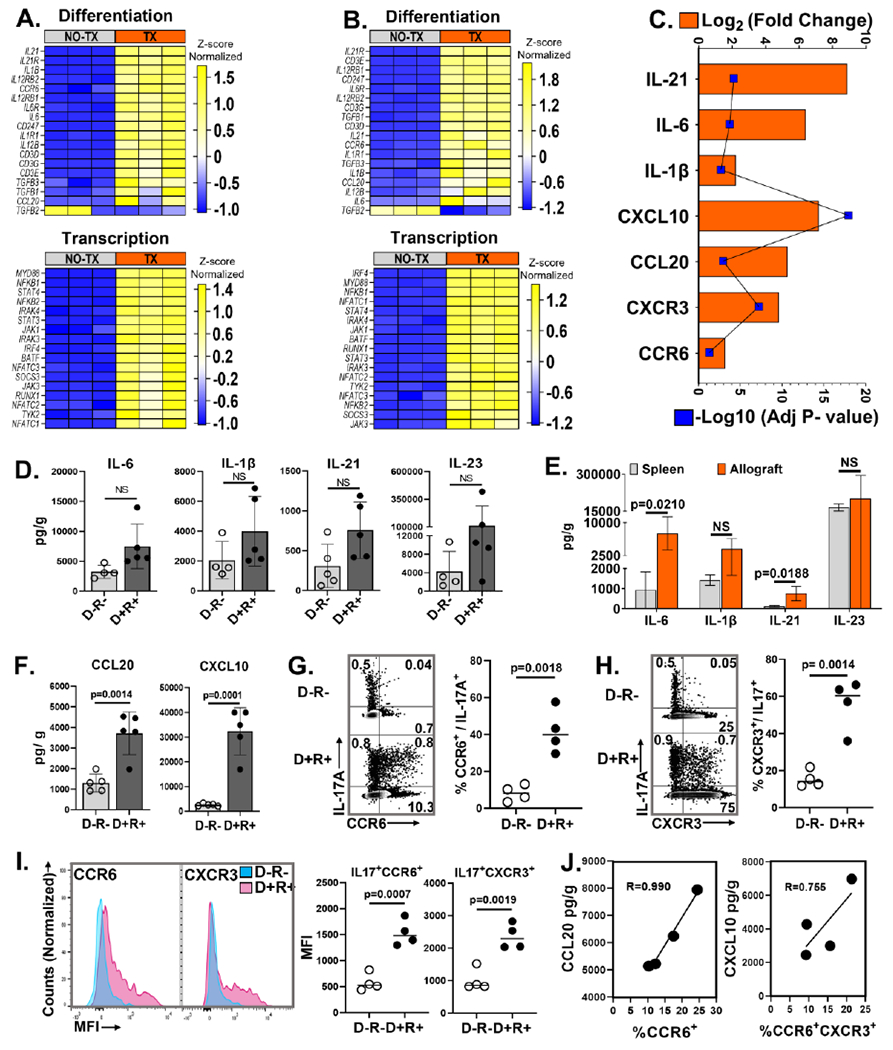
Figure 3. MCMV infected allograft microenvironment favors Th17 cell recruitment.

(A, B, C) Gene expression profiles by RNA-seq. (A) Heat map shows differentially expressed genes encoding molecules required for Th17 cell differentiation and transcription factors between D+ allografts (TX) and infected non- transplant kidneys (NO-TX). and (B) Differentially expressed Th17 cells related genes between D− allografts (TX) and uninfected non- transplant kidneys (NO-TX) Each column represents a single sample whereas rows represent intensities of gene expression. Hierarchical clustering of the genes was performed based on the average column z- score, highest (top) to lowest (bottom). (C) Transcripts for Th17 cell differentiating cytokines and recruiting chemokines are upregulated in D+ transplants compared to MCMV infected native kidneys. (D) Comparison of intragraft Th17 cell differentiating cytokine quantities between D−R− and D+R+ transplants. (E) Quantities of Th17 cell differentiating cytokines in D+R+ spleens and allografts. (F) Comparison of Th17 cell recruiting chemokine quantities in D−R− and D+R+ allografts. (G, H) Representative flow plots and frequencies of CCR6+ and CXCR3+ Th17 cells in D−R− and D+R+ allografts. (I) Mean fluorescence intensity (MFI) of CCR6 and CXCR3 expression for Th17 cells from D−R− (Blue) and D+R+ (Pink) allografts. (J) Correlation between intragraft chemokines and receptors expressed by Th17 cells from D+R+ transplants. All data are represented as mean ± standard deviation (SD) and are analyzed by two- sided Student’s t-test or Pearson correlation. NS, not significant (p>0.05).
